Differentiation of iPSCs into Insulin-Producing Beta Cells: A Comprehensive Guide for Research and Therapy Development
This article provides a comprehensive analysis of the process to differentiate human induced pluripotent stem cells (iPSCs) into functional, insulin-producing beta cells.
Differentiation of iPSCs into Insulin-Producing Beta Cells: A Comprehensive Guide for Research and Therapy Development
Abstract
This article provides a comprehensive analysis of the process to differentiate human induced pluripotent stem cells (iPSCs) into functional, insulin-producing beta cells. It covers the foundational biology of pancreatic development, details current multi-stage differentiation protocols utilizing growth factors and small molecules, and addresses key challenges including functional maturation, scalability, and tumorigenicity. The content also explores the application of iPSC-derived beta cells in disease modeling, drug screening, and cell replacement therapy, with a focus on validation techniques and comparative analysis against primary islets. Intended for researchers, scientists, and drug development professionals, this review synthesizes recent advances and outlines future directions for translating this technology into clinical solutions for diabetes.
From Pluripotency to Pancreatic Fate: Understanding the Biological Blueprint
The Diabetes Burden and the Need for Beta Cell Replacement
Diabetes mellitus represents a global metabolic disease crisis, characterized by persistent hyperglycemia resulting from defects in insulin secretion or impaired insulin action [1] [2]. The International Diabetes Federation reports approximately 425 million adults aged 20-79 were living with diabetes in 2017, with projections indicating a rise to 629 million affected individuals by 2045 [1]. Over the past three decades, the global prevalence of diabetes has surged fourfold, establishing it as the ninth leading cause of reduced life expectancy worldwide [1]. This chronic condition not only requires lifelong management but significantly increases the risk of mortality from cardiovascular diseases, stroke, kidney damage, diabetic retinopathy, and neuropathy [3].
The pathophysiology differs between the two main forms of diabetes. Type 1 diabetes (T1D) involves autoimmune destruction of pancreatic β-cells leading to absolute insulin deficiency, while type 2 diabetes (T2D) features both functional decline of insulin-producing β-cells and systemic insulin resistance [1]. Current treatment strategies primarily involve continuous administration of exogenous insulin, which remains the only economical mode of treatment available for T1D and a common mainstay for T2D alongside pharmaceutical agents [4]. While whole pancreas transplantation and islet transplantation offer potential solutions, these approaches face significant limitations including scarcity of donor material, surgical risks, and the requirement for lifelong immunosuppression [1] [4]. The Edmonton protocol for islet cell transplantation, while showing improved outcomes achieving normoglycemia in 87.5% of patients at 1 year, still depends on limited cadaveric islet availability and carries risks of transplant rejection and complications from immunosuppression [1].
iPSC Technology: A Promising Solution
Induced pluripotent stem cell (iPSC) technology, introduced by Shinya Yamanaka in 2006, represents a paradigm shift in regenerative medicine approaches to diabetes [3]. By reprogramming somatic cells to a pluripotent state through introduction of specific transcription factors (Yamanaka factors), iPSCs can differentiate into any cell type in the body while avoiding the ethical concerns associated with embryonic stem cells [3] [1]. The ability of iPSCs to differentiate into insulin-producing β-cells offers unprecedented opportunities for both disease modeling and cell replacement therapy for diabetes [3] [5].
Research in this field has demonstrated exponential growth from 2008 to 2021, with the United States leading in publications (28% of total), followed by China (13.8%), Japan (12.3%), the United Kingdom (4.1%), and Italy (3.9%) [3]. The United States not only leads in publication volume but also maintains a broader network of international collaborators, with 21.1% of its publications involving multi-country collaborations [3]. Current research hotspots include applying iPSCs to study pathological mechanisms of diabetes, disease modeling, drug screening, gene expression profiling, and investigating the degeneration process of β-cells [3].
Table 1: Global Research Output on iPSCs in Diabetes (2008-2025)
| Country | Publications (n) | Publication Percentage | Single Country Publications | Multi Country Publications | MCP Percentage |
|---|---|---|---|---|---|
| USA | 171 | 28.0% | 135 | 36 | 21.1% |
| China | 84 | 13.8% | 68 | 16 | 19.0% |
| Japan | 75 | 12.3% | 69 | 6 | 8.0% |
| United Kingdom | 25 | 4.1% | 11 | 14 | 56.0% |
| Italy | 24 | 3.9% | 17 | 7 | 29.2% |
Pancreatic Development: Insights for Protocol Design
The process of generating functional β-cells from iPSCs relies on recapitulating key stages of natural pancreatic embryogenesis [4]. Human pancreas specification begins from the foregut-midgut boundary, forming from anterior endoderm invagination during Carnegie Stage 10 [4]. During early CS13, the first signs of dorsal pancreas budding from the foregut endoderm begins, with the dorsal bud forming the pancreatic tail, neck and part of the pancreatic head, while the ventral bud forms the uncinate process and part of the pancreatic head [4].
Several transcription factors play crucial roles in pancreatic development. PDX1 (pancreatic and duodenal homeobox 1) represents the most significant and earliest marker of pancreatic progenitor cells, essential for initiating formation of both ventral and dorsal pancreatic primordia and branching of the pancreatic buds [4]. NEUROG3 (neurogenin 3) initiates the endocrine program during pancreatic organogenesis by activating expression of downstream transcription factors responsible for maturation and lineage specification of endocrine precursors [4]. NKX6.1, a homeobox protein, plays an indispensable role during both early and late stages of pancreatic development [4]. Understanding these developmental mechanisms provides the foundation for designing effective differentiation protocols.
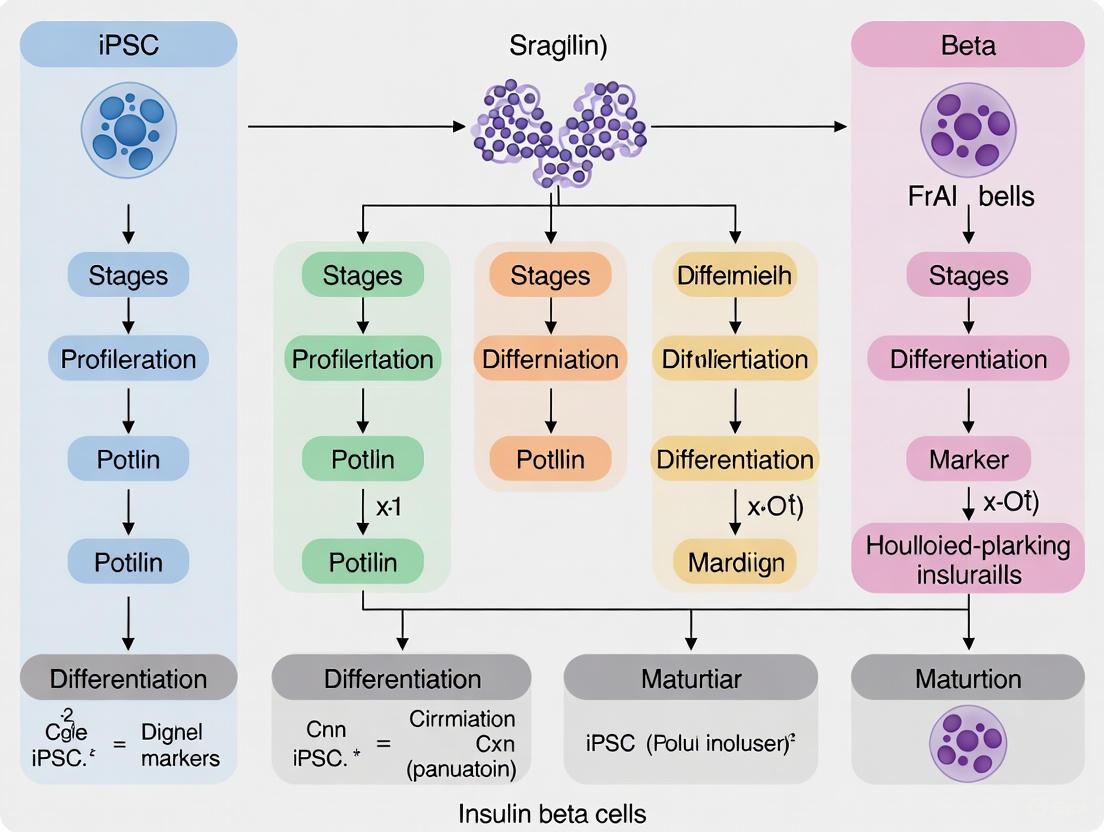
Figure 1: Stepwise Differentiation Protocol from iPSCs to Functional β-Cells
Application Notes: Differentiation Methodologies
2D vs. 3D Differentiation Systems
Current differentiation protocols employ either two-dimensional (2D) or three-dimensional (3D) culture systems, each with distinct advantages and limitations. The 3D environment allows better cell-to-cell communication and correct cellular polarization, which is crucial for proper islet architecture and β-cell functionality [6]. In static microwell systems, homogeneously small-sized islet-like aggregates can be obtained, while rotating suspension cultures often produce heterogeneous sizes with frequent aggregation clumping [6]. Research demonstrates that iPSCs differentiated with equal efficiency into β-cells in microwells compared to rotating suspension, but the former had a higher experimental success rate [6].
A critical advancement in disease modeling occurred with the development of 3D organotypic culture systems that facilitate better self-organization and lineage specification [6]. Natural scaffold-based strategies rely on laminin-rich Matrigel, pure laminins, collagens or other biomaterials which favor cell differentiation and functionality, though pure extracellular matrix proteins are costly and limit large-scale organoid production [6]. For large-scale production, β-cells can be differentiated in dynamic suspension cultures or bioreactors, though organoid formation and size control remains challenging [6].
Protocol Efficiency and Characterization
Efficient differentiation protocols consistently generate pancreatic islet-like aggregates with yields of insulin-positive β-cells comparable to human islets [6]. Using optimized 7-stage protocols, research groups have reported final cell populations highly enriched for β-cells, with 75-80% of cells consistently staining double positive for the markers C-peptide and NKX6.1 [7]. Flow cytometry analysis typically shows 24±2% and 27±2% of cells co-expressing C-peptide+/NKX6.1+ for T1D and non-diabetic (ND) cells, respectively [8]. When analyzed with electron microscopy, both T1D and ND SC-β cells contain developing and mature insulin granules similar to β-cell granules [8].
Table 2: Characterization of iPSC-Derived β-Cells from Diabetic and Non-Diabetic Donors
| Parameter | T1D SC-β Cells | ND SC-β Cells | Measurement Technique |
|---|---|---|---|
| C-peptide+/NKX6-1+ cells | 24±2% | 27±2% | Flow cytometry |
| Insulin content | 210±40 μIU per 10³ cells | 220±20 μIU per 10³ cells | ELISA measurement |
| Glucose-stimulated insulin secretion | 2.0±0.4 μIU/10³ cells | 1.9±0.3 μIU/10³ cells | GSIS assay at 20mM glucose |
| Stimulation index | 1.9 | 2.2 | Ratio (20mM/2mM glucose) |
| Response to glucose challenges | 88% | 78% | Percentage of responsive batches |
Functional Validation In Vitro and In Vivo
In vitro functionality is typically assessed by glucose-stimulated insulin secretion (GSIS), NAD(P)H and calcium fluctuations [6]. Stage 7 aggregates generally show slight increases in insulin release in response to glucose in vitro [6]. However, extensive research indicates that in vitro differentiation typically generates aggregates lacking fully mature β-cell function, requiring in vivo maturation for complete functionality [6].
Transplantation studies under the kidney capsule of immunocompromised mice demonstrate that grafts develop glucose-responsiveness and maintain normoglycemia after streptozotocin injection [6]. After 2 weeks post-transplantation, graft function shows human insulin detection with glucose responsiveness in most mice (81% for T1D SC-β cells and 77% for ND SC-β cells) [8]. The ratio of insulin secretion after glucose challenge compared to before challenge averages 1.4 and 1.5 for T1D and ND SC-β cells, respectively [8]. Importantly, both T1D and ND SC-β cells continue to function for >5 months in vivo, maintaining fasting blood glucose <200 mg/dl, secreting human insulin in response to glucose injection, and rapidly clearing glucose after challenge [8].
Research Reagent Solutions
Table 3: Essential Research Reagents for iPSC to β-Cell Differentiation
| Reagent Category | Specific Examples | Function in Differentiation |
|---|---|---|
| Pluripotency Maintenance | mTeSR1 medium, Vitronectin XF, Y-27632 (ROCK inhibitor) | Maintain iPSCs in undifferentiated state, enhance survival after passaging |
| Definitive Endoderm Induction | Activin A, CHIR99021 (WNT agonist) | Direct differentiation toward definitive endoderm lineage |
| Pancreatic Progenitor Specification | FGF10, Retinoic acid, SANT-1 (Hedgehog inhibitor), Noggin (BMP antagonist) | Pattern definitive endoderm into pancreatic progenitors |
| Endocrine Commitment | TGF-β inhibitors (ALK5i), Thyroid hormone (T3), Nicotinamide | Promote endocrine differentiation and β-cell maturation |
| Characterization Antibodies | Anti-PDX1, Anti-NKX6.1, Anti-C-peptide, Anti-NEUROG3 | Identify specific differentiation stages by immunostaining |
| Functional Assay Reagents | Glucose solutions, Insulin ELISA kits, Calcium dyes | Assess β-cell function through GSIS and signaling assays |
Scaling Challenges and Manufacturing Solutions
Transitioning from laboratory-scale protocols to large-scale manufacturing presents significant challenges. Recent research has identified that stage time increase and limited media replenishing with lactate accumulation can increase the differentiation capacity of insulin-producing cells cultured in large-scale suspension environments [9]. A three-stage suspension manufacturing process has been developed, transitioning from adherent to suspension culture, with specialized media supporting iPSC growth during scaling [9].
Bioreactor systems using vertical wheel designs have demonstrated improved differentiation outcomes compared to traditional static cultures. Continuous bioreactor runs have been utilized to study nutrient and growth limitations and their impact on differentiation, showing metabolic shifts and a more β-cell-like differentiation profile compared to control media change bioreactors [9]. Importantly, cryopreserved aggregates harvested from these runs maintain viability and insulin secretion capacity post-recovery, indicating their potential for storage and future transplantation therapies [9].
Advanced monitoring systems incorporating daily sampling for cell counting, aggregate size analysis, and islet equivalency (IEQ) estimates have been implemented using flow cytometry and automated imaging systems [9]. Quantitative PCR analysis at different stages throughout culture time provides crucial quality control metrics, while flow cytometry testing at the end of each differentiation stage ensures consistent marker expression across batches [9].
Future Perspectives and Clinical Translation
The field of iPSC-derived β-cells continues to evolve rapidly, with more than hundred patients dosed in clinical trials with ESC-derived cells and a single trial of iPSC-derived cells [1]. A clinical trial presented at the 83rd Scientific Sessions of the American Diabetes Association showcased VX-880, a stem cell-derived islet cell therapy, as a potential treatment for T1D, demonstrating restored insulin secretion, improved glycemic control, and elimination of severe hypoglycemic events in all six treated patients [9].
Emerging research directions include integrating immune evasion mechanisms and gene therapy, particularly by enhancing islet cell survival and function through immune regulation and genetic modification [3]. Epigenetic research has identified key regulators such as KDM4A, a histone demethylase, whose knockdown significantly reduces expression of pancreatic β-cell genes (PDX1, Nkx6.1, and Ins) by 50% and decreases glucose-stimulated insulin secretion by approximately 80% [10]. These findings emphasize the critical role of histone demethylation in hiPSC differentiation toward β-cells and suggest epigenetic modulation could enhance generation of functional β-cells for regenerative medicine in diabetes [10].
Despite these advancements, challenges remain in generating fully functional and mature β-cells from hPSCs, with protocol efficiency varying greatly among different hESC and hiPSC lines [4]. This variability poses a particular challenge for generating patient-specific β-cells. The ultimate goal remains developing a highly efficient directed differentiation protocol applicable across all genetic backgrounds of hPSCs, ensuring safety and efficacy of hPSC-derived pancreatic islets before widespread clinical utilization [4].
The field of regenerative medicine was transformed by the emergence of technologies to generate induced pluripotent stem cells (iPSCs), which represent a groundbreaking alternative to embryonic stem cells (ESCs). Pluripotent stem cells are defined by their capacity for unlimited self-renewal and their ability to differentiate into virtually any adult cell type [11]. Traditionally, human disorders were studied using animal models or patient-derived somatic cells, but these systems presented significant limitations for modeling many genetic diseases [11]. The isolation of human ESCs from the inner cell mass of blastocysts in 1998 provided a powerful new tool for developmental biology and disease modeling [12]. However, the use of human ESCs raised ethical concerns regarding embryo destruction and was subject to regulatory restrictions in many countries [11] [13].
The landmark discovery of iPSC technology by Shinya Yamanaka's lab in 2006 fundamentally changed the stem cell research landscape [12] [14]. Takahashi and Yamanaka demonstrated that the introduction of just four transcription factors (Oct4, Sox2, Klf4, and Myc, collectively known as OSKM or Yamanaka factors) could reprogram mouse embryonic fibroblasts into pluripotent stem cells [12]. This revolutionary finding was quickly followed in 2007 by the successful generation of human iPSCs by both Yamanaka and James Thomson's groups, the latter using a slightly different combination of factors (OCT4, SOX2, NANOG, and LIN28) [12] [14]. These discoveries revealed that somatic cell fate could be reversed through epigenetic reprogramming, earning Gurdon and Yamanaka the 2012 Nobel Prize in Physiology or Medicine and opening new avenues for disease modeling, drug screening, and cell-based therapies [12].
Molecular Principles of iPSC Induction
Historical Foundations of Nuclear Reprogramming
The conceptual foundation for iPSC technology was established through decades of pioneering research in nuclear reprogramming. In 1962, John Gurdon's seminal somatic cell nuclear transfer (SCNT) experiments in Xenopus laevis frogs demonstrated that a nucleus isolated from a terminally differentiated intestinal epithelial cell could, when transplanted into an enucleated egg, support the development of germline-competent organisms [12]. This revolutionary finding established that the process of cell differentiation does not involve irreversible changes to the genetic material, but rather reversible epigenetic modifications that can be reset by factors present in the oocyte cytoplasm. The reversibility of the somatic cell state was further supported by cell fusion experiments in the early 2000s, which showed that fusion of mouse or human ESCs with somatic cells resulted in heterokaryons that were reprogrammed to pluripotency [12]. Concurrently, transdifferentiation experiments demonstrated that forced expression of lineage-specific transcription factors, such as C/EBPα/β, could directly convert B cells into macrophages, highlighting the power of transcription factors in reshaping cell identity [12].
The molecular basis of cellular plasticity lies in the epigenetic landscape that governs gene expression patterns. The Waddington epigenetic landscape model, proposed in 1957, conceptualized cell differentiation as a ball rolling downhill through branching valleys toward increasingly restricted and stable states [12]. In 1958, David Nanney proposed that while DNA sequence confers gene expression potential, phenotypic differences in genetically identical cells arise from "epigenetic" systems that regulate gene expression specificities [12]. We now understand that these epigenetic mechanisms include DNA methylation, histone modifications, chromatin remodeling, and non-coding RNA regulation, which together establish and maintain cell type-specific gene expression patterns without altering the underlying DNA sequence. The process of reprogramming somatic cells to iPSCs involves the erasure of these somatic epigenetic signatures and their replacement with a pluripotency-associated epigenetic landscape [12].
Mechanisms of Somatic Cell Reprogramming
The reprogramming of somatic cells to pluripotency involves profound remodeling of the epigenome and global changes in gene expression. When pluripotent stem cells differentiate into somatic cells, they acquire stable epigenetic memory and undergo chromatin conformation changes that inactivate pluripotency-specific genes while activating somatic cell-specific genes [12]. Reprogramming reverses this process, effectively "rewinding" the developmental clock through a sequence that partially mirrors developmental events in reverse [12].
Reprogramming occurs in two broad phases: an early, stochastic phase followed by a late, more deterministic phase [12]. During the early phase, somatic genes are silenced while early pluripotency-associated genes are activated. This initial phase is highly inefficient and stochastic, likely due to limited accessibility of closed chromatin regions to the reprogramming factors [12]. The late phase involves activation of late pluripotency-associated genes and establishment of a stable self-renewing pluripotent state. Universal aspects of reprogramming are accompanied by somatic cell type-specific reprogramming trajectories and transient events [12]. The process entails comprehensive remodeling of chromatin structure, epigenome, and multiple aspects of cell biology including metabolism, cell signaling, intracellular transport, and proteostasis [12]. Since fibroblasts are the most common starting cell type for reprogramming, mesenchymal-to-epithelial transition (MET) represents another critical event during iPSC generation [12].
Table 1: Key Molecular Events During Somatic Cell Reprogramming
| Reprogramming Phase | Epigenetic Changes | Transcriptional Changes | Cellular Processes |
|---|---|---|---|
| Early Phase (Stochastic) | Initiation of DNA demethylation at pluripotency loci; Early chromatin accessibility changes | Silencing of somatic genes; Activation of early pluripotency genes | MET; Changes in cell morphology; Initiation of proliferation changes |
| Late Phase (Deterministic) | Establishment of pluripotent epigenome; DNA methylation resetting; X chromosome reactivation | Activation of core pluripotency network (OCT4, NANOG, SOX2); Downregulation of lineage-specific factors | Metabolic shift to glycolysis; Acquisition of unlimited self-renewal capacity; Telomerase activation |
Methods for iPSC Generation and Characterization
Reprogramming Methods
Since the original description of iPSC generation using retroviral vectors, numerous technical approaches have been developed to improve the efficiency and safety of reprogramming. The choice of reprogramming method depends on the specific application, with integration-free methods being essential for clinical applications.
Table 2: Comparison of iPSC Reprogramming Methods
| Method | Key Features | Efficiency | Advantages | Disadvantages | Clinical Applicability |
|---|---|---|---|---|---|
| Integrating Viruses (Retrovirus/Lentivirus) | Stable integration of reprogramming factors; OSKM expression | 0.01%-0.1% | High efficiency; Well-established protocol | Risk of insertional mutagenesis; Persistent transgene expression | Limited due to safety concerns |
| Non-integrating Viruses (Sendai Virus, Adenovirus) | RNA virus-based delivery; Non-integrating | 0.001%-0.01% | No genomic integration; Relatively efficient | Requires virus clearance; Potential immunogenicity | More suitable, with virus clearance |
| Episomal Vectors | OriP/EBNA1-based plasmids; Replicated in dividing cells | ~0.0005% | Non-integrating; Simple delivery | Low efficiency; Requires transfection | Suitable with careful screening |
| mRNA Reprogramming | Synthetic modified mRNAs; Daily transfections | ~1% | High efficiency; Non-integrating; Defined | Requires multiple transfections; Potential immune response | Highly suitable |
| Small Molecule Reprogramming | Chemical compounds that replace reprogramming factors | Varies by cocktail | Non-genetic; Cost-effective; Scalable | Often used to enhance other methods | Highly promising |
| Protein Reprogramming | Direct delivery of recombinant reprogramming proteins | Very low (<0.001%) | Non-genetic; Minimal safety concerns | Extremely low efficiency; Technically challenging | Theoretically ideal but impractical |
The original reprogramming factors identified by Yamanaka (OCT4, SOX2, KLF4, and MYC) remain the most widely used, though alternative combinations have been successfully employed, including Thomson's combination (OCT4, SOX2, NANOG, and LIN28) for human cell reprogramming [12]. OCT4 and SOX2 are considered core pluripotency factors, while KLF4 and MYC are thought to enhance reprogramming efficiency by promoting proliferation and epigenetic remodeling [12]. Small molecules have been increasingly incorporated into reprogramming protocols to enhance efficiency, replace certain transcription factors, or direct the reprogramming process. The first fully chemical reprogramming of murine fibroblasts using seven small-molecule compounds was reported in 2013 [12].
Characterization of Pluripotent Stem Cells
Both ESCs and iPSCs must be rigorously characterized to confirm their pluripotent identity and functional capacity. Standard characterization includes:
- Morphology: Pluripotent stem cells form compact colonies with well-defined borders and high nucleus-to-cytoplasm ratios.
- Pluripotency Marker Expression: Immunocytochemistry and flow cytometry for core pluripotency transcription factors (OCT4, NANOG, SOX2) and surface markers (TRA-1-60, TRA-1-81, SSEA-3, SSEA-4).
- Gene Expression Analysis: RT-PCR or RNA-seq to detect expression of endogenous pluripotency genes and silence of reprogramming transgenes.
- Epigenetic Status: Assessment of DNA methylation status at key pluripotency gene promoters.
- In Vitro Differentiation: Formation of embryoid bodies and spontaneous differentiation into derivatives of all three germ layers.
- In Vivo Differentiation: Teratoma formation assay in immunocompromised mice, with histological confirmation of tissues representing all three germ layers.
- Karyotype Analysis: G-banding or spectral karyotyping to confirm genomic integrity.
While iPSCs and ESCs share fundamental characteristics of pluripotency, detailed comparisons have revealed subtle but potentially important differences. Proteomic analyses have shown that while hiPSCs and hESCs express a nearly identical set of proteins, they display consistent quantitative differences in protein expression levels [15]. iPSCs demonstrate increased total protein content, with elevated abundance of cytoplasmic and mitochondrial proteins required to sustain high growth rates, including nutrient transporters and metabolic enzymes [15]. These molecular differences correlate with functional phenotypes, including enhanced metabolic activity and increased production of secreted proteins including ECM components and growth factors [15].
Advantages of iPSCs over ESCs
iPSC technology offers several significant advantages over ESCs for research and therapeutic applications:
Ethical Advantages
iPSCs avoid the ethical controversies associated with the destruction of human embryos that has limited ESC research and led to regulatory restrictions in many countries [11] [13]. By enabling the generation of pluripotent stem cells from readily accessible somatic tissues, iPSC technology provides an ethically uncontroversial alternative that has expanded stem cell research globally.
Practical and Technical Advantages
From a practical standpoint, iPSCs offer numerous technical advantages. The derivation of mutant ESCs from affected embryos identified by preimplantation genetic diagnosis (PGD) is limited to a small number of diseases and requires access to in vitro fertilization (IVF) facilities [11]. In contrast, iPSCs can be generated from patients with any genetic disorder, at any age, using minimally invasive procedures such as skin biopsy or blood draw. Furthermore, in ESC-based models, the correlation between genotype and phenotype may be obscured by protective genetic backgrounds, whereas patient-derived iPSCs naturally present the complete genetic context in which the disease manifests [11].
Personalized Medicine Applications
The ability to generate patient-specific iPSCs enables the development of truly personalized regenerative therapies. Autologous iPSC-derived cells should theoretically avoid immune rejection without requiring immunosuppression, though this advantage requires further validation [16]. Patient-specific iPSCs also facilitate the development of personalized disease models and drug screening platforms that account for individual genetic variability.
Applications in Diabetes Research: Differentiation into Insulin-Producing Beta Cells
Protocol for Differentiation of iPSCs to Pancreatic Beta Cells
The differentiation of iPSCs into functional insulin-producing beta cells represents a promising approach for cell replacement therapy for type 1 diabetes (T1D). T1D is characterized by autoimmune destruction of pancreatic beta cells, resulting in absolute insulin deficiency [17]. Current treatment relies on exogenous insulin administration, which cannot perfectly replicate physiological glucose regulation and often leads to long-term complications [17]. Replacement of functional beta cells through transplantation of cadaveric islets has proven effective but is limited by donor scarcity and the need for lifelong immunosuppression [16] [17].
We detail a robust, six-stage planar differentiation protocol for generating SC-β cells that secrete high amounts of insulin in response to glucose stimulation [18]. This protocol generates SC-islets containing multiple endocrine cell types, including glucagon-producing alpha cells and somatostatin-producing delta cells, resembling native pancreatic islets [16].
Diagram 1: Differentiation protocol for generating SC-β cells from human iPSCs. Key signaling molecules are shown in blue ovals.
Table 3: Six-Stage Planar Differentiation Protocol for Generating SC-β Cells from iPSCs
| Stage | Duration | Key Signaling Molecules | Target Cell Population | Characteristic Markers |
|---|---|---|---|---|
| Stage 1: Definitive Endoderm Induction | 3 days | Activin A, CHIR99021 (Wnt activator) | Definitive endoderm | SOX17, FOXA2, CXCR4 |
| Stage 2: Primitive Gut Tube Formation | 2 days | Keratinocyte Growth Factor (KGF) | Primitive gut tube | HNF1B, HNF4A, PDX1 (low) |
| Stage 3: Posterior Foregut Patterning | 5 days | SANT1 (Hedgehog inhibitor), TPPB (PKC activator), LDN193189 (BMP inhibitor), Retinoic Acid | Posterior foregut | PDX1, NKX6-1, SOX9 |
| Stage 4: Pancreatic Progenitor Specification | 7-9 days | Continued from Stage 3 with adjusted concentrations | Pancreatic progenitors | PDX1+/NKX6-1+ |
| Stage 5: Endocrine Progenitor Induction | 7 days | Latrunculin A (cytoskeletal modulator), XXI, T3, ALK5 inhibitor II, SANT1, Retinoic Acid | Endocrine progenitors | NEUROG3, INS, GCG |
| Stage 6: SC-β Cell Maturation | 7-14 days | Basal media with low glucose | SC-β cells and islet-like clusters | NKX6-1/C-Peptide+, MAFA, Glucose-responsive insulin secretion |
This protocol eliminates the need for 3D culture during endocrine induction, simplifying the methodology while generating highly functional SC-β cells [18]. The resulting SC-β cells and other endocrine cell types can be aggregated into islet-like clusters for analysis and transplantation [18]. The entire process requires approximately 34 days to generate functional SC-β cells, plus an additional 1-2 weeks for initial stem cell expansion and final cell assessment [18].
The Scientist's Toolkit: Essential Reagents for iPSC Differentiation
Table 4: Essential Research Reagents for iPSC to Beta Cell Differentiation
| Reagent Category | Specific Examples | Function in Differentiation |
|---|---|---|
| Reprogramming Factors | OCT4, SOX2, KLF4, MYC (OSKM); OCT4, SOX2, NANOG, LIN28 | Induction of pluripotency in somatic cells |
| Basal Media | mTeSR, E8 medium | Maintenance of pluripotent stem cells |
| Growth Factors | Activin A, Keratinocyte Growth Factor (KGF) | Definitive endoderm induction; primitive gut tube formation |
| Small Molecule Inhibitors | CHIR99021 (Wnt activator), SANT1 (Hedgehog inhibitor), LDN193189 (BMP inhibitor), ALK5 inhibitor II (TGF-β inhibitor) | Pathway modulation to direct pancreatic differentiation |
| Signaling Molecules | Retinoic Acid, T3 (thyroid hormone) | Patterning and maturation of pancreatic endocrine cells |
| Cytoskeletal Modulators | Latrunculin A | Enhancement of endocrine differentiation efficiency |
| Characterization Antibodies | Anti-OCT4, SOX17, FOXA2, PDX1, NKX6-1, C-Peptide, Insulin | Identification of specific cell populations during differentiation |
| Functional Assays | Glucose Stimulated Insulin Secretion (GSIS); ELISA for C-peptide/insulin; Electrophysiology | Validation of SC-β cell function |
Disease Modeling and Drug Screening Applications
iPSC technology has enabled the generation of patient-specific beta cells for modeling various forms of diabetes, including type 1 diabetes (T1D), type 2 diabetes (T2D), monogenic diabetes (MD), and cystic fibrosis-related diabetes (CFRD) [16]. These disease-specific iPSC-derived beta cells allow researchers to study disease mechanisms, progression, and potential therapeutic interventions in a human-relevant system [16]. The combination of disease modeling with gene editing technologies such as CRISPR-Cas9 enables the correction of diabetes-causing mutations, providing both insights into disease mechanisms and a potential pathway for autologous cell therapy [16].
For drug development, iPSC-derived beta cells offer a physiologically relevant human cell system for identifying and validating drug targets, screening compounds for efficacy, and conducting toxicology studies [14] [19]. The availability of patient-specific cells enables the development of personalized medicine approaches, where drug responses can be tested in vitro before administration to patients [14]. The adoption of the FDA Modernization Act 2.0, which permits cell-based assays as alternatives to animal testing for drug applications, has further accelerated the use of iPSC-derived cells in pharmaceutical development [14].
iPSC technology has revolutionized stem cell research and regenerative medicine by providing an ethically acceptable, patient-specific source of pluripotent stem cells. While ESCs and iPSCs share fundamental properties of pluripotency, quantitative proteomic analyses have revealed consistent differences in protein expression patterns, particularly in metabolic and secretory pathways [15]. These differences may reflect the reprogramming process or the distinct developmental origins of these cells and warrant consideration when selecting a stem cell platform for specific applications.
In the context of diabetes research, iPSC technology offers unprecedented opportunities for disease modeling, drug screening, and cell replacement therapy. The development of robust differentiation protocols for generating glucose-responsive SC-β cells from patient-specific iPSCs represents a major advancement toward personalized cell therapy for diabetes [16] [18]. Ongoing efforts focus on improving the maturation and function of SC-β cells, enhancing their engraftment and survival after transplantation, and developing strategies to protect them from autoimmune rejection [16] [17].
The iPSC field continues to evolve rapidly, with advances in reprogramming technologies, differentiation protocols, gene editing, and tissue engineering. The global iPSC market is projected to grow significantly, reaching USD 4.69-5.12 billion by 2033-2034, driven by increasing demand for patient-specific cell therapies and disease models [20] [19]. As the technology matures and overcomes current challenges in manufacturing, safety, and regulatory approval, iPSC-based therapies hold immense promise for transforming the treatment of diabetes and other degenerative diseases.
Recapitulating Embryonic Pancreas Development In Vitro
The in vitro recapitulation of embryonic pancreas development is a cornerstone of modern regenerative medicine strategies for diabetes. This process aims to generate functional, insulin-producing β-cells from induced pluripotent stem cells (iPSCs) by meticulously mimicking the sequential stages of natural organogenesis [1] [21]. Success in this endeavor holds the potential to provide an unlimited cell source for transplantation, moving beyond the limitations of donor pancreata and lifelong immunosuppression [1] [3]. The foundation of all contemporary differentiation protocols lies in a deep understanding of the spatiotemporal cues and transcriptional networks that guide pancreatic progenitor cells toward a mature endocrine fate in the embryo [1] [22]. This document provides a detailed experimental framework for modeling early human pancreas development using iPSC-based organoid systems, designed for researchers and drug development professionals working at the intersection of developmental biology and disease modeling.
Key Findings from Recent Investigations
Recent single-cell RNA sequencing (scRNA-seq) studies of human embryonic pancreas between post-conception weeks (PCW) 4 and 11 have provided an unprecedented view of early development. These analyses reveal a complex cellular heterogeneity and distinct lineage trajectories for dorsal and ventral multipotent progenitor (MP) cells [22].
- Dorsal vs. Ventral MP Cells: Dorsal MP cells express
NR2F1and are associated with Wnt signaling and cell junction assembly. In contrast, ventral MP cells expressTBX3andSOX11and are linked to ribosome assembly and muscle tissue development [22]. - Signaling from Mesenchyme: Notch and MAPK signals from surrounding mesenchymal cells have been identified as critical regulators directing the differentiation of multipotent cells into trunk and ductal lineages [22].
- Identification of Procr-like Cells: A recent investigation identified a
Procr-like cell population in the mouse and human embryonic pancreas, which shares a transcriptional signature with a putative adult progenitor population. These cells areNeurog3negative and display a profile that includesRspo1,Dcn, andUpk3b, suggesting a potential, though debated, role in developmental or regenerative processes [23].
Table 1: Key Transcription Factors in Pancreatic Development and Differentiation
| Gene | Function in Development | Role in iPSC Differentiation |
|---|---|---|
| PDX1 | Master regulator of pancreatic progenitor specification; expressed in early buds [1] [22] | Critical initial checkpoint for definitive pancreatic fate [1] [21] |
| PTF1A | Specific to pancreatic progenitors; promotes tip cell and acinar fate [1] [22] | Used to specify pancreatic progenitor population [21] |
| NKX6.1 | Regulates trunk cell fate and β-cell precursor maintenance/maturation [1] [22] | Essential for functional β-cell maturation; a key marker for polyhormonal vs. monohormonal fate [21] [7] |
| NEUROG3 | Master regulator of endocrine differentiation; drives delamination of endocrine progenitors [22] | Induces endocrine commitment; its expression is transiently activated [21] |
| SOX9 | Expressed in multipotent progenitor cells and ductal cells [1] [22] | Marker for multipotent and bipotent progenitor stages [21] |
| MAFA | Regulates final β-cell maturation and insulin production [1] | Late-stage marker indicating functional maturation of derived β-cells [1] |
Table 2: Characterization of Major Cell Types During Early Human Pancreas Development (PCW 4-11)
| Cell Type | Key Markers | Developmental Timeline (PCW) | Function/Fate |
|---|---|---|---|
| Multipotent Progenitor (MP) | PDX1+, PTF1A+, NKX6.1+, FOXA2+ [22] |
4-5 | Founder population for all pancreatic epithelial lineages |
| Dorsal MP | NR2F1+ [22] |
4-5 | Gives rise to dorsal bud lineages |
| Ventral MP | TBX3+, SOX11+ [22] |
4-5 | Gives rise to ventral bud lineages; shares origin with pancreato-biliary progenitors |
| Tip / Acinar Progenitor | CPA2+, RBPJL+, CTRB2+ [22] |
Emerges from ~PCW 7 | Committed to exocrine/acinar differentiation |
| Trunk / Bipotent Progenitor | HES4+, DCDC2+ [22] |
Emerges from ~PCW 7 | Gives rise to both ductal and endocrine lineages |
| Endocrine Progenitor (EP) | NEUROG3+ [22] |
Peaks after PCW 8 | Transient population committed to endocrine cell fate |
| Immature β-cell | INS+, NKX6.1+, MAFA- [1] |
Appears after PCW 8 | Immature insulin-producing cell; requires further maturation |
Experimental Protocols
hPSC-Based Matrigel-Overlay Organoid Differentiation
This protocol outlines a robust method for generating key pancreatic cell types, including multipotent progenitors, endocrine progenitors, and hormone-producing cells, within a 3D organoid structure [21].
Key Materials:
- Cells: Human Pluripotent Stem Cells (hPSCs), including iPSCs or ESCs.
- Basal Media: DMEM/F12 or other defined base medium.
- Induction Factors: Recombinant growth factors and small molecules (see Table 4).
- 3D Matrix: Matrigel, Growth Factor Reduced.
- Culture Vessels: Multi-well plates for monolayer and 3D culture.
Detailed Procedure:
Pre-culture of hPSCs as a 2D Monolayer:
- Maintain hPSCs in a feeder-free culture system using essential media like mTeSR or StemFlex.
- Culture cells on tissue culture plates coated with a suitable substrate (e.g., Matrigel, Geltrex).
- Passage cells at 70-80% confluence using a gentle cell dissociation reagent. Ensure cells maintain a high pluripotency status (e.g., >90% OCT4-positive) before initiating differentiation.
Definitive Endoderm (DE) Induction (Days 1-3):
- Day 0: When hPSCs reach ~80% confluence, switch to a definitive endoderm induction medium.
- Base Medium: RPMI 1640.
- Key Inducers: Add 100 ng/mL Activin A and 3 µM CHIR99021 (a GSK-3β inhibitor activating WNT signaling) [21].
- Serum Gradient: On Day 1, use 0% FBS; on Day 2, switch to 0.2% FBS.
- Quality Control: Assess efficiency by flow cytometry for DE markers SOX17 and FOXA2. A successful induction should yield >80% double-positive cells.
Primitive Gut Tube (PGT) and Posterior Foregut (PF) Induction (Days 4-6):
- Day 4-5 (PGT): Change medium to DMEM with 2% FBS, supplemented with 50 ng/mL FGF7 (KGF).
- Day 6 (PF): Switch to a medium that promotes posterior foregut fate. A common formulation includes DMEM with 1% B27, 0.5 µM Retinoic Acid (RA), 500 nM LDN193189 (a BMP inhibitor), and 200 nM Sant1 (a Sonic Hedgehog inhibitor) [21].
Application of Matrigel Overlay and Pancreatic Progenitor (PP) Induction (Days 7-12):
- Day 7: This is a critical step for establishing the 3D niche. Gently overlay the cells with a thin layer of cold, diluted Matrigel (e.g., a 1:1 mix of Matrigel and culture medium).
- Pancreatic Induction Medium: Use DMEM with 1% B27, and continue supplementation with 0.5 µM RA, 200 nM Sant1, and 50 ng/mL FGF7. Additional factors like 10 µM Y-27632 (ROCK inhibitor) can be added to support cell survival during this transition.
- Culture: Maintain the cells with this 3D Matrigel overlay, changing the medium every 2-3 days.
- Monitoring: By Day 12, the cells should form distinct 3D epithelial structures. Analyze for co-expression of PDX1 and NKX6.1 via immunostaining to confirm successful pancreatic progenitor specification.
Endocrine Progenitor (EP) and Hormone-Producing Cell Induction (Days 13-20+):
- Day 13-17 (EP): Switch to an endocrine induction medium. This often involves DMEM with 1% B27, 10 µM ALK5 inhibitor II (to reduce TGF-β signaling), 10 µM T3 (Thyroid Hormone), and 100 nM Gamma-secretase inhibitor XX (to modulate Notch signaling and promote endocrine differentiation).
- Day 18+ (Endocrine Maturation): For final maturation into hormone-expressing cells, use a basal medium like CMRL with 1% B27, 10 µM T3, and 10 µM ALK5 inhibitor II. This stage can be extended for several weeks to promote functional maturation, marked by the acquisition of MAFA expression in INS+/NKX6.1+ β-cells [21].
3D Culture of Mouse Embryonic Pancreas Progenitors
This protocol summarizes a method for the extensive expansion and self-organization of dispersed mouse embryonic pancreatic progenitor cells within a 3D Matrigel scaffold [24].
Key Steps:
- Tissue Isolation: Dissect the dorsal pancreatic bud from E10.5-E11.5 mouse embryos in cold PBS or DMEM.
- Tissue Dissociation: Mechanically dissociate and incubate the tissue with collagenase to obtain a single-cell suspension.
- 3D Embedding: Resuspend the dispersed cells in liquid Matrigel and plate droplets onto a pre-warmed culture dish to polymerize.
- Culture: Overlay the Matrigel droplets with a defined medium. The composition of the medium can be manipulated:
- For progenitor expansion, use a medium favoring proliferation (e.g., with FGF10).
- For differentiated organoids, use a medium containing serum, which supports differentiation into acinar, ductal, and endocrine cells, and spontaneous self-organization into branched structures [24].
Signaling Pathways and Logical Workflows
The following diagrams illustrate the key signaling pathways and experimental workflows for recapitulating pancreatic development in vitro.
Diagram 1: Core Signaling Pathways in Pancreatic Progenitor Specification
Core Signaling Pathways in Pancreatic Progenitor Specification
Diagram 2: Organoid Differentiation Workflow
Organoid Differentiation Workflow
Diagram 3: PI3K-AKT-FoxO1 Pathway in Beta Cells
PI3K-AKT-FoxO1 Pathway in Beta Cells
The Scientist's Toolkit: Research Reagent Solutions
Table 4: Essential Reagents for In Vitro Pancreas Differentiation
| Reagent / Tool | Function / Target | Application Example in Protocol |
|---|---|---|
| Activin A | TGF-β family ligand; induces definitive endoderm differentiation. | Used in high concentration (100 ng/mL) in the first stage to direct hPSCs to SOX17+/FOXA2+ endoderm [21]. |
| CHIR99021 | GSK-3β inhibitor; activates WNT signaling. | Paired with Activin A during definitive endoderm induction to enhance efficiency [21]. |
| Retinoic Acid (RA) | Morphogen; patterns the posterior foregut and specifies pancreatic identity. | Critical component at the posterior foregut to pancreatic progenitor transition (e.g., 0.5 µM) [21]. |
| LDN193189 | Small molecule inhibitor of BMP signaling. | Used during posterior foregut and pancreatic specification to block non-pancreatic fates [21]. |
| Sant1 | Small molecule antagonist of Sonic Hedgehog (SHH) signaling. | Applied during pancreatic specification to inhibit SHH, which is necessary for pancreatic commitment [21]. |
| FGF7 (KGF) | Growth factor; promotes growth and patterning of gut endoderm. | Used during primitive gut tube and pancreatic progenitor stages to support progenitor growth [21]. |
| Matrigel | Basement membrane extract providing a 3D scaffold. | Used as an overlay to create a 3D epithelial niche that supports morphogenesis and polarity [24] [21]. |
| Y-27632 (ROCKi) | ROCK inhibitor; reduces apoptosis in dissociating cells. | Often added during passaging or the transition to 3D culture to improve cell survival [21]. |
| ALK5 Inhibitor II | Small molecule inhibitor of TGF-β receptor ALK5. | Used during endocrine differentiation to reduce TGF-β signaling, which can inhibit endocrine fate [21]. |
| Gamma-Secretase Inhibitor | Inhibits Notch signaling, promoting endocrine differentiation. | Applied to endocrine progenitor stage to derepress NEUROG3 and allow endocrine lineage commitment [21]. |
Table 5: Comparison of 3D Culture Systems for Pancreatic Cells
| Characteristic | Matrigel-Embedded Organoids | Alginate-Encapsulation | Scaffold-Free Spheroids |
|---|---|---|---|
| Principle | Cells embedded in a complex 3D ECM scaffold [24] [21] | Single cells or clusters encapsulated in a semi-permeable hydrogel [25] | Cells self-aggregate in non-adherent conditions [25] |
| Key Advantages | Supports complex morphogenesis, cell polarity, and self-organization; recapitulates tissue architecture [24] | Immunoisolation potential for transplantation; tunable mechanical properties [25] | Simplicity; strong cell-cell contacts; no foreign material [25] |
| Reported Outcomes | Generation of multipotent progenitors, endocrine cells, and branched structures [24] [21] | Enhanced GSIS and PDX1 expression via PI3K/AKT/FoxO1 pathway vs. 2D [25] | Improved GSIS and viability over 2D; but may be inferior to alginate in some functional measures [25] |
| Primary Application | Modeling development and disease; studying morphogenesis [21] | Cell transplantation and therapy [25] | Drug screening; basic islet function studies [25] |
Key Transcription Factors and Signaling Pathways in Beta Cell Differentiation (PDX1, NGN3, NKX6.1, MAFA)
The differentiation of induced pluripotent stem cells (iPSCs) into functional, glucose-responsive beta cells represents a transformative strategy for disease modeling, drug screening, and cell replacement therapy for diabetes [3] [6]. Central to this process are key transcription factors that orchestrate pancreatic development and beta cell maturation. Among these, PDX1 (Pancreas/Duodenum Homeobox Protein 1), NEUROG3 (Neurogenin-3, also abbreviated as NGN3), NKX6.1, and MAFA (Musculoaponeurotic Fibrosarcoma Oncogene Homolog A) form a critical regulatory network guiding cellular identity and function [26] [27]. This application note details the roles of these factors within the context of iPSC differentiation, provides quantitative data on their expression and function, and outlines detailed experimental protocols for their manipulation and assessment. The content is framed for researchers and drug development professionals aiming to implement or optimize beta cell differentiation protocols, with a focus on generating functionally mature insulin-producing cells.
Roles of Key Transcription Factors
The differentiation of iPSCs into beta cells follows a developmental pathway mimicking in vivo pancreatic organogenesis, requiring precisely timed expression of specific transcription factors.
Table 1: Key Transcription Factors in Beta Cell Differentiation
| Transcription Factor | Primary Role in Development | Expression Timing | Target Genes/Pathways | Human Disease Link |
|---|---|---|---|---|
| PDX1 | Pancreatic progenitor formation, beta cell maturation and function [26] [27] | Early: Human gestational week 4; sustained in mature beta cells [27] | Insulin, MAFA, Glucokinase [26] | MODY4, Pancreatic Agenesis [26] [27] |
| NEUROG3 (NGN3) | Endocrine progenitor specification, master regulator of islet cell fate [26] | Mid-gestation; peaks and declines before hormone expression [26] | NEUROD1, INSM1 [26] | Permanent Neonatal Diabetes [26] |
| NKX6.1 | Beta cell specification and maturation; often co-expressed with PDX1 [28] | Following pancreatic specification in PDX1+ progenitors [28] | Unknown direct targets, essential for functional maturation [28] | Associated with T2D risk [27] |
| MAFA | Beta cell terminal maturation and glucose-stimulated insulin secretion (GSIS) [26] | Late gestation; increases after birth [26] | Insulin, Genes for glucose sensing and exocytosis [26] | Polymorphisms linked to T1D and T2D [26] |
The following diagram illustrates the temporal sequence and functional relationships of these key transcription factors during the differentiation process:
Figure 1: Simplified workflow of iPSC differentiation into beta cells, showing key transitional stages and the corresponding core transcription factors.
Functional Interactions and Chromatin Regulation
The transcription factors PDX1, NEUROG3, and MAFA do not operate in isolation but form a tightly regulated network. PDX1 is critical for initiating the pancreatic program and, in mature beta cells, binds to and activates the insulin gene [26]. It also regulates the expression of NEUROG3, thereby controlling the emergence of the endocrine lineage [26]. NEUROG3 acts as a pro-endocrine "master regulator" and is essential for the differentiation of all islet cell types, including beta cells [26]. Finally, MAFA is a key integrator of beta cell maturity, exclusively expressed in beta cells and vital for activating insulin gene expression in response to glucose [26].
Successful differentiation requires not only the presence of these factors but also profound remodeling of the chromatin landscape. Studies have shown that the SWI/SNF chromatin remodeling complex, particularly its BRG1 and BRM subunits, is essential for proper endocrine cell expansion and differentiation. Loss of SWI/SNF function in endocrine progenitors leads to reduced expression of Mafa, Ins1, and Ins2, and compromises beta cell differentiation capacity [29]. Furthermore, the removal of Polycomb-mediated repression is a key mechanism for activating stage-specific genes during pancreatic differentiation of human ESCs. Inefficient removal of this repression in in vitro-differentiated endocrine cells is associated with their functional immaturity [30].
Experimental Protocols for Beta Cell Differentiation and Analysis
This section provides detailed methodologies for differentiating iPSCs into beta-like cells and for assessing the resulting cells' function and molecular profile.
Protocol 1: Forward Programming of hiPSCs Using Inducible Transcription Factors
This protocol, adapted from a 2024 study, uses inducible lentiviral vectors to drive the expression of NGN3, PDX1, and MAFA (NPM factors) to accelerate beta cell differentiation [28].
Key Reagent Solutions:
- Inducible Lentiviral System: A two-vector system is used. The first vector, pLentiEF1a-rtTABsdR, provides a blasticidin-resistant transactivator. The second, pLentiTRE-NPMHygR, contains the NGN3, PDX1, and MAFA genes under a doxycycline-inducible promoter and confers hygromycin resistance [28].
- Cell Line: Human iPSCs.
- Culture Medium: Pancreatic progenitor induction medium, typically containing factors like Activin A, FGF, and Retinoic Acid to support pancreatic lineage commitment.
- Induction Agent: Doxycycline (1-2 µg/mL) to activate transgene expression.
Procedure:
- Lentiviral Transduction: Sequentially transduce hiPSCs with the EF1a-rtTABsdR lentivirus and then the TRE-NPMHygR lentivirus.
- Selection: Select successfully transduced cells using blasticidin (1.0 µg/mL for 5 days) and hygromycin B (25.0 µg/mL for 6 days). The resulting cell line is termed rtTA-NPM hiPSCs.
- Differentiation Induction: Seed rtTA-NPM hiPSCs and culture them in pancreatic progenitor induction medium supplemented with doxycycline for 5-10 days to induce transgene expression and initiate differentiation.
- 3D Aggregation (Optional): For further maturation, dissociate the cells and aggregate them into 3D spheroids using platforms like AggreWell plates or rotating suspension cultures.
- Analysis: Assess the expression of key markers (PDX1, NKX6.1, MAFA, Insulin) via qPCR and immunofluorescence. Evaluate functionality using Glucose-Stimulated Insulin Secretion (GSIS) assays.
Expected Outcomes: Cells should show upregulated expression of pancreatic and beta cell markers within five days of induction. In vitro GSIS response may be limited, often resembling a fetal, rather than adult, functional profile [28].
Protocol 2: Directed Differentiation in 3D Culture
This protocol is based on a widely used, multi-stage directed differentiation approach, with a focus on generating homogenous 3D islet-like aggregates to enhance maturation [6].
Key Reagent Solutions:
- Basal Media: DMEM, F12, or other specialized base media.
- Key Signaling Molecules: A sequence of growth factors and small molecules, including Activin A (for definitive endoderm), KGF (for foregut/pancreatic progenitors), Retinoic Acid (for pancreatic specification), and TPB (a PKC activator for endocrine maturation).
- 3D Culture Platform: Static microwells (e.g., AggreWell400) or rotating suspension bioreactors.
Procedure:
- Staged Differentiation (Stages 1-4): Differentiate iPSCs in a 2D monolayer through sequential stages to generate definitive endoderm, primitive gut tube, and posterior foregut/PDX1+ pancreatic progenitor cells.
- 3D Aggregation (Stage 5): At the pancreatic progenitor stage, dissociate cells and transfer to a 3D culture system. Aggregation in static microwells at a density of 750 cells/microwell is recommended to generate uniform, small-sized aggregates and prevent central necrosis.
- Endocrine Induction and Maturation (Stages 6-7): Continue culture in media containing endocrine induction and maturation factors (e.g., TPB, Aldosterone, Thyroid hormone) for several weeks.
- In Vivo Maturation (Optional): Transplant aggregates under the kidney capsule of immunodeficient mice (e.g., NOD-SCID). Grafts typically acquire more mature functional characteristics within 2-3 months post-transplantation [6].
Expected Outcomes: The resulting 3D aggregates should contain insulin-positive cells with a yield comparable to human islets. While they may show only a slight glucose response in vitro, they become highly glucose-responsive and can maintain normoglycemia in diabetic mice after transplantation [6].
Table 2: Quantitative Functional Comparison of Beta Cells from Different Protocols
| Characteristic | Forward Programming (2D) [28] | Directed 3D Differentiation (In Vitro) [6] | Directed 3D + In Vivo Maturation [6] | Primary Human Islets |
|---|---|---|---|---|
| Timeline | 10-14 days | ~4-6 weeks | 3-4 months (incl. transplant) | N/A |
| Insulin+ Cells | Low (marker expression) | High (comparable to human islets) | High | Benchmark |
| In Vitro GSIS | Limited, fetal-like | Slight increase | Not Tested (graft removed) | Strong response |
| In Vivo Function | Not Tested | Not Applicable | Restores normoglycemia in mice | Benchmark |
| Key Markers | NGN3, PDX1, MAFA (mRNA) | PDX1, NKX6.1, MAFA, Insulin (protein) | PDX1, NKX6.1, MAFA, Insulin (protein) | All mature markers |
The Scientist's Toolkit: Essential Research Reagents
The following table compiles key reagents and tools critical for research in this field, as derived from the cited protocols.
Table 3: Essential Research Reagents for Beta Cell Differentiation Studies
| Reagent / Tool Category | Specific Examples | Function / Application |
|---|---|---|
| Transcription Factor Tools | Inducible lentiviral vectors for NGN3, PDX1, MAFA [28]; CRISPR/dCas9-P300core for epigenetic activation [31] | Driving beta cell fate through overexpression or targeted gene activation. |
| Cell Culture Media & Supplements | Activin A, FGF, Retinoic Acid, KGF, TPB, Aldosterone, Thyroid Hormone (T3) [6] [28] | Mimicking developmental signaling to guide stepwise differentiation. |
| 3D Culture Systems | AggreWell plates (static microwells) [6]; Rotating suspension bioreactors [6] | Promoting cell-cell interactions and organoid formation for enhanced maturation. |
| Key Antibodies for Characterization | Anti-PDX1, Anti-NKX6.1, Anti-NEUROG3, Anti-MAFA, Anti-Insulin, Anti-C-Peptide [27] [6] | Confirming protein expression and identity of progenitors and mature beta cells via immunofluorescence. |
| Functional Assay Kits | Glucose-Stimulated Insulin Secretion (GSIS) Assay; ELISA for Human Insulin/C-Peptide; Calcium Flux Assay Kits [6] | Quantifying dynamic insulin release and beta cell functional maturity. |
The coordinated actions of PDX1, NEUROG3, NKX6.1, and MAFA are indispensable for the successful generation of functional beta cells from iPSCs. While current protocols can produce insulin-producing cells, achieving a fully mature adult phenotype remains a challenge. The experimental approaches detailed here, from forward programming to sophisticated 3D differentiation, provide a robust foundation for researchers. Future work must focus on refining the temporal control of these transcription factors and optimizing the epigenetic landscape to generate beta cells that are functionally indistinguishable from their native human counterparts, thereby unlocking their full potential for therapeutic applications.
The Definitive Endoderm as a Critical First Step
The differentiation of human induced pluripotent stem cells (hiPSCs) into insulin-producing beta cells represents a transformative strategy for cell therapy in diabetes. Within this multi-stage process, the precise specification of definitive endoderm (DE) is the indispensable foundational step, forming the embryonic germ layer from which the pancreas, liver, lungs, and intestines develop [32] [33]. This stage establishes the cellular context for all subsequent lineage decisions, and its efficiency directly dictates the yield and purity of the final beta cell product. Current research focuses on refining DE induction protocols to achieve high efficiency and reproducibility using both growth factor-based and novel chemically-defined systems [33] [34]. This application note details the critical methodologies and quality control measures for successful DE specification, framed within the broader objective of generating functional, transplantable beta cells for diabetes treatment.
Key Signaling Pathways in DE Specification
The in vitro specification of DE from hiPSCs aims to recapitulate the embryonic gastrulation events governed by key signaling pathways. The Nodal/Activin A signaling pathway, a branch of the Transforming Growth Factor-Beta (TGF-β) family, is the primary driver of endodermal fate [35]. Concurrent activation of the Wnt/β-catenin pathway is crucial as it enhances the expression of key transcription factors and potentiates the response to Nodal/Activin signaling [36]. Recent studies have highlighted the role of GRP94, an endoplasmic reticulum chaperone, in regulating the WNT/β-catenin pathway during this process. GRP94 depletion has been shown to hinder DE specification by reducing WNT signaling activation and promoting ER stress-induced cell death [36]. Furthermore, a novel chemically defined system has identified TEAD3 as a key regulator, working alongside pioneers like GATA4 to reconfigure chromatin architecture, making it accessible for DE-associated transcription factors such as SOX17 and FOXA2 [34]. The following diagram illustrates the logical progression of signaling events and transcriptional activation during this critical phase.
Comparative Analysis of DE Induction Methods
Two primary methodological approaches are widely used for DE induction: the Growth Factor (GF) Protocol and the Small Molecule (SM) Protocol [33]. The GF approach utilizes recombinant proteins, primarily Activin A and Wnt3a, to directly activate the key signaling pathways. In contrast, the SM approach employs a GSK-3 inhibitor, CHIR99021, to modulate the Wnt pathway and endogenous Nodal gene expression as a single agent. A comparative study demonstrated that both protocols produce DE with similar high efficiency, morphological phenotype, and expression of hallmark markers (SOX17, FOXA2, CXCR4) [33]. However, divergence in subsequent lineage specification, such as hepatic commitment, has been observed, underscoring the importance of selecting an induction method aligned with the target endodermal derivative [33]. More recently, a fully chemically defined, growth factor-free system (termed "4C") has been developed, enabling highly efficient DE specification without recombinant proteins, thereby enhancing scalability and reducing costs for clinical translation [34].
Table 1: Quantitative Comparison of Definitive Endoderm Induction Protocols
| Protocol Feature | Growth Factor (GF) Protocol | Small Molecule (SM) Protocol | Chemically Defined (4C) System |
|---|---|---|---|
| Key Inducing Factors | Activin A (100 ng/mL), Wnt3a (25 ng/mL) [33] [35] | CHIR99021 (3-6 µM) [33] [34] | Combination of 4 small molecules [34] |
| Base Media | RPMI 1640 [33] [35] | RPMI 1640 [33] | Chemically defined [34] |
| Duration | 3 days [33] [35] | 3-4 days [33] [34] | Not specified |
| Key Markers Post-Differentiation | SOX17, FOXA2, CXCR4 [33] | SOX17, FOXA2, CXCR4 [33] | SOX17, FOXA2 [34] |
| Reported Efficiency | High (>80% SOX17+) [33] [35] | High (>80% SOX17+) [33] | Highly efficient [34] |
| Primary Advantage | Established, direct pathway activation | Cost-effective, simplified formulation [33] [34] | Growth factor-free, scalable for manufacture [34] |
Detailed Experimental Protocol for DE Induction
Materials and Reagents
Table 2: Research Reagent Solutions for DE Differentiation
| Reagent / Material | Function / Application | Example Product / Source |
|---|---|---|
| Human iPSCs | Starting cell population for differentiation | Patient-specific or banked iPSC lines [33] |
| Matrigel / Vitronectin | Extracellular matrix coating for cell adhesion | L7 hPSC Matrix [37] or Vitronectin (Qk120) [35] |
| Activin A | TGF-β family ligand; primary inducer of DE fate | Recombinant Human Activin A [33] [35] |
| CHIR99021 | GSK-3 inhibitor; activates Wnt signaling | Stemolecule CHIR99021 [33] [35] |
| BMP4 | Bone Morphogenetic Protein; aids initial specification | Recombinant Human BMP4 [35] |
| FGF-2 (bFGF) | Fibroblast Growth Factor; supports DE specification | Qkine FGF2-G3 (Qk053) [35] |
| LY294002 | PI3K inhibitor; enhances DE purity | LY294002 [35] |
| ROCK Inhibitor (Y-27632) | Prevents anoikis in single-cell passaging | Y-27632 [38] [35] [37] |
| Anti-SOX17 Antibody | Immunocytochemistry for DE marker | R&D systems, AF1924 [37] |
| Anti-FOXA2 Antibody | Immunocytochemistry for DE marker | Abcam, ab108422 [37] |
Step-by-Step Workflow
The following protocol is adapted from established methodologies [33] [35] [37] and is designed for a 6-well plate format.
Day 0: Seeding hiPSCs
- Preparation: Coat culture plates with Matrigel (or equivalent like vitronectin) according to manufacturer's instructions.
- Cell Dissociation: Detach hiPSCs using Accutase or EDTA to create a single-cell suspension.
- Seeding: Seed cells at a density of 0.25 - 1.0 x 10^6 cells per well in complete hiPSC maintenance medium (e.g., mTeSR1 or E8) supplemented with 10 µM Y-27632 (ROCK inhibitor) to enhance survival [35] [37].
- Incubation: Place cells in a 37°C incubator with 5% CO₂.
Day 1: Initiating Differentiation
- Media Change: Aspirate the maintenance medium.
- Induction Medium: Add DE 1 medium. For a GF protocol, this typically consists of RPMI 1640 base supplemented with 100 ng/mL Activin A, 25 ng/mL Wnt3a (optional for Day 1 only), 80 ng/mL FGF-2, 10 ng/mL BMP4, and 10 µM LY294002 [35]. For an SM protocol, use RPMI/B27 with 6 µM CHIR99021 [33].
Day 2: Continuing Induction
Day 3: Final Day of Induction
Day 4: Analysis and Harvest
- Assessment: Differentiated DE cells can be harvested for downstream differentiation or analyzed for quality control on Day 4 or 5.
- Quality Control (QC): Fix a representative sample of cells for immunocytochemical analysis of DE markers SOX17 and FOXA2.
Quality Control and Validation
Rigorous quality control is essential to confirm successful DE specification before proceeding to subsequent stages like pancreatic progenitor induction. The primary method for validation is the assessment of protein and gene expression for hallmark DE markers.
- Immunocytochemistry (ICC): This is the gold standard for visualizing DE markers. A successful differentiation will show high co-expression of the transcription factors SOX17 and FOXA2 in the cell nuclei, typically exceeding 80% of the cell population [33] [35] [37]. The surface marker CXCR4 (CD184) is also commonly used in conjunction with intracellular markers for flow cytometry analysis [38] [33].
- Flow Cytometry: This method allows for the quantitative assessment of differentiation efficiency. Cells can be stained for surface CXCR4 and intracellular SOX17/FOXA2. High-quality DE populations should demonstrate a high percentage of double-positive cells (e.g., SOX17+/FOXA2+ or CXCR4+/SOX17+).
- qPCR: Gene expression analysis can confirm the upregulation of key DE-associated genes (SOX17, FOXA2, CXCR4, GATA4) and the concomitant downregulation of pluripotency markers (OCT4, NANOG).
Troubleshooting and Technical Notes
- Low Differentiation Efficiency: If SOX17/FOXA2 expression is low (<70%), verify the activity and concentration of the primary inducing factors (Activin A, CHIR99021). Ensure consistent and timely media changes. Check the pluripotency and health of the starting hiPSC population.
- High Cell Death: This is common during the first 24 hours of differentiation. Ensure the use of a ROCK inhibitor during the initial cell seeding. Confirm that the cell seeding density is optimal, as both overly confluent and sparse cultures can lead to poor outcomes. Mathematical modeling suggests plating populations closer to 300,000 cells per well can optimize yield efficiency [38].
- Batch-to-Batch Variability: To minimize variability, use high-quality, animal origin-free recombinant proteins and small molecules. Standardize the passage number and maintenance conditions of the parent hiPSC line. Consider adopting a completely chemically defined system like the 4C protocol to reduce reliance on recombinant proteins [34].
- Scale-Up Considerations: For manufacturing scales, transitioning from planar culture to suspension bioreactors (e.g., Vertical Wheel bioreactors) can enable uniform, large-scale production of DE with minimal variability and reduced cell loss [39].
Protocols and Applications: From Bench to Bedside
Diabetes mellitus (DM), a metabolic disorder characterized by chronic hyperglycemia, affects millions of adults worldwide, with projections estimating 700 million cases by 2045 [32] [17]. Type 1 diabetes (T1D) results from autoimmune destruction of pancreatic β-cells, leading to absolute insulin deficiency [32]. Current treatment paradigms, primarily lifelong insulin injections, face significant limitations in mimicking physiological insulin secretion kinetics and preventing secondary complications [17]. Allogeneic pancreatic islet transplantation, particularly under the Edmonton protocol, has demonstrated therapeutic success but remains constrained by donor scarcity and risks of immunosuppression [32] [17].
Differentiation of induced pluripotent stem cells (iPSCs) into insulin-producing cells (IPCs) represents a promising alternative that could overcome these limitations [32]. Patient-specific iPSCs, obtained via reprogramming of somatic cells, offer the potential for autologous transplantation while avoiding immune rejection [32]. Contemporary differentiation protocols emulate natural pancreatic embryogenesis through sophisticated multi-stage approaches, activating specific signaling pathways with precise temporal control [32] [4]. This protocol analysis examines the stepwise differentiation of human iPSCs into functional pancreatic β-cells, detailing the morphological changes, key signaling pathways, and quality control checkpoints at each developmental stage.
Stage-by-Stage Differentiation Protocol
The differentiation of iPSCs into functional pancreatic β-cells recapitulates in vivo pancreatic development, progressing through definitive endoderm, primitive gut tube, pancreatic progenitor, endocrine progenitor, and finally mature β-cell stages [40]. Each transition is controlled by specific signaling molecules and growth factors that direct cellular fate toward the pancreatic lineage.
Detailed Stage Analysis and Experimental Methodologies
Stage 1: Definitive Endoderm Induction (Days 0-3)
The initial differentiation stage directs pluripotent cells toward definitive endoderm, the embryonic germ layer that gives rise to pancreatic tissue. This process mimics gastrulation events, where epiblast cells undergo epithelial-mesenchymal transition to form primitive streak and subsequently definitive endoderm.
Key Signaling Pathways: TGF-β/Nodal/Activin A signaling combined with WNT pathway activation serves as the primary inducer of definitive endoderm [40]. High concentrations of Activin A (100 ng/mL) activate Nodal-like signaling, while WNT3A or GSK3-β inhibitors (CHIR99021, 3-6 μM) enhance primitive streak formation [40]. PI3K inhibitors (LY294002 or Wortmannin) and JNK-JUN signaling inhibition improve definitive endoderm yield by blocking alternative differentiation paths [40].
Experimental Protocol:
- Culture Preparation: Plate human iPSCs at high density (∼85% confluence) on Matrigel-coated plates in mTeSR1 medium 24 hours before differentiation.
- Day 0-1 Medium: RPMI 1640 supplemented with Activin A (100 ng/mL), CHIR99021 (3 μM), and 0.2% FBS. Incubate for 24 hours.
- Day 1-2 Medium: Replace with RPMI 1640 containing Activin A (100 ng/mL) with 0.2% FBS.
- Day 2-3 Medium: Replace with RPMI 1640 containing Activin A (100 ng/mL) with 2% FBS.
- Quality Control: Assess efficiency via flow cytometry for CXCR4, SOX17, and FOXA2. Target >90% positive cells [40]. CD177-positive subpopulations show enhanced pancreatic commitment [40].
Stage 2: Primitive Gut Tube Formation (Days 3-5)
Following definitive endoderm specification, cells progress toward a primitive gut tube phenotype, with particular emphasis on posterior foregut development where pancreatic buds emerge.
Key Signaling Pathways: Fibroblast growth factor (FGF) signaling, particularly through FGF10 (50 ng/mL) or keratinocyte growth factor (KGF), promotes gut tube formation and inhibits hepatic differentiation [40]. BMP signaling modulation helps pattern the gut tube along the anterior-posterior axis.
Experimental Protocol:
- Days 3-5 Medium: DMEM supplemented with FGF10 (50 ng/mL) or KGF (50 ng/mL), with 1% B27 supplement.
- Culture Conditions: Maintain cells in adherent culture with daily medium changes.
- Quality Control: Verify emergence of gut tube morphology and expression of HNF1β, HNF4α, and additional endodermal markers.
Stage 3: Pancreatic Progenitor Specification (Days 5-12)
This critical stage establishes pancreatic commitment with the emergence of PDX1-positive progenitor cells that possess both endocrine and exocrine potential.
Key Signaling Pathways: Retinoic acid (RA, 0.5-2 μM) synergizes with FGF10 (50 ng/mL) to promote pancreatic specification [40]. Sonic hedgehog (SHH) inhibition (using cyclopamine, 0.25-1 μM) enhances dorsal pancreatic fate. BMP signaling requires careful modulation, with initial inhibition followed by low-level activation.
Experimental Protocol:
- Days 5-8 Medium: DMEM with FGF10 (50 ng/mL), RA (0.5-2 μM), cyclopamine (0.25-1 μM), and Noggin (50 ng/mL) for BMP inhibition.
- Days 8-12 Medium: Transition to DMEM with FGF10 (50 ng/mL), RA (0.5-2 μM), and Noggin (50 ng/mL), gradually reducing FGF10 concentration.
- Quality Control: Assess PDX1 and NKX6.1 co-expression via immunostaining. Target >80% PDX1+ cells with substantial NKX6.1+ population [4]. PDX1+/NKX6.1+ progenitors demonstrate strong β-cell commitment potential.
Stage 4: Endocrine Progenitor Induction (Days 12-18)
Pancreatic progenitors transition to endocrine-committed progenitors under Notch signaling inhibition, enabling endocrine differentiation.
Key Signaling Pathways: Notch pathway inhibition (using DAPT, 10 μM) initiates endocrine differentiation by lifting lateral inhibition [4]. BMP signaling inhibition continues during early endocrine specification. Thyroid hormone (T3, 1 nM) promotes endocrine maturation.
Experimental Protocol:
- Days 12-15 Medium: DMEM with DAPT (10 μM), Noggin (50 ng/mL), and T3 (1 nM).
- Days 15-18 Medium: DMEM with ALK5 inhibitor II (10 μM), T3 (1 nM), and γ-secretase inhibitor (10 μM).
- Quality Control: Monitor NGN3 (NEUROG3) expression as a marker of endocrine commitment [4]. Assess emergence of endocrine hormones (insulin, glucagon) via immunocytochemistry.
Stage 5: β-Cell Maturation (Days 18-30+)
The final stage focuses on functional maturation of immature β-cells into glucose-responsive endocrine cells capable of dynamic insulin secretion.
Key Signaling Pathways: TGF-β signaling inhibition (ALK5i, 10 μM) promotes endocrine differentiation [4]. Thyroid hormone (T3) supports metabolic maturation. Cell aggregation into islet-like clusters enhances maturation through cell-cell contact and 3D architecture.
Experimental Protocol:
- Days 18-21 Medium: CMRL medium with ALK5 inhibitor II (10 μM), T3 (1 nM), and γ-secretase inhibitor (10 μM).
- Days 21-30+ Medium: Maturation medium containing T3 (1 nM), R428 (1 μM), N-acetyl cysteine (10 μM), and 10% FBS.
- 3D Culture: Detach cells and culture in suspension to form islet-like aggregates using low-adhesion plates.
- Quality Control: Evaluate insulin content (≥0.5-1 μg/μg DNA), glucose-stimulated insulin secretion (GSIS) with stimulation index ≥2, and expression of mature β-cell markers (MAFA, UCN3) [4].
Key Transcription Factor Expression Profile
The progression through differentiation stages correlates with specific transcription factor expression patterns that define cell identity and developmental progression.
Table 1: Key Transcription Factors in Pancreatic β-Cell Differentiation
| Developmental Stage | Key Transcription Factors | Functional Role |
|---|---|---|
| Pluripotency | OCT4, SOX2, NANOG | Maintain pluripotent state |
| Definitive Endoderm | SOX17, FOXA2, CXCR4 | Endoderm specification and migration |
| Pancreatic Progenitors | PDX1, PTF1A, SOX9 | Pancreatic commitment and proliferation |
| Endocrine Progenitors | NEUROG3, NEUROD1, PAX4 | Endocrine lineage specification |
| Immature β-Cells | NKX6.1, NKX2.2, PAX6 | β-cell identity and differentiation |
| Mature β-Cells | MAFA, PDX1, NEUROD1, UCN3 | Functional maturation and glucose responsiveness |
PDX1 represents the cornerstone of pancreatic organogenesis, essential for both initial pancreatic specification and mature β-cell function [4]. NEUROG3 serves as the master regulator of endocrine commitment, activating downstream transcription factors including NEUROD1 and NKX6.1 [4]. NEUROD1 maintains the mature phenotype of pancreatic β-cells and regulates insulin gene expression [4]. NKX6.1 plays an indispensable role during both early and late stages of pancreatic development, with sustained expression critical for functional β-cell identity [4].
Research Reagent Solutions
Successful differentiation requires precise combination of signaling molecules, growth factors, and culture supplements at specific developmental timepoints.
Table 2: Essential Research Reagents for iPSC to β-Cell Differentiation
| Reagent Category | Specific Examples | Function | Typical Concentration |
|---|---|---|---|
| WNT Pathway Activators | CHIR99021, WNT3A | Promotes primitive streak and mesendoderm formation | 3-6 μM (CHIR99021) |
| TGF-β/Activin A Signaling | Activin A, GDF8 | Induces definitive endoderm specification | 100 ng/mL (Activin A) |
| FGF Signaling | FGF10, KGF | Patterns gut tube and promotes pancreatic commitment | 50 ng/mL |
| Retinoid Signaling | Retinoic Acid (RA) | Specifies pancreatic progenitor identity | 0.5-2 μM |
| SHH Inhibitors | Cyclopamine, SANT-1 | Enhances dorsal pancreatic fate | 0.25-1 μM |
| BMP Inhibitors | Noggin, LDN-193189 | Patterns foregut and pancreatic progenitors | 50 ng/mL (Noggin) |
| Notch Inhibitors | DAPT, RO4929097 | Initiates endocrine differentiation | 10 μM |
| TGF-β Inhibitors | ALK5i II, SB431542 | Promotes endocrine commitment | 10 μM |
| Maturation Factors | T3, R428, N-acetyl cysteine | Supports functional β-cell maturation | 1 nM (T3) |
Signaling Pathway Integration
The coordinated temporal sequence of signaling pathway activation and inhibition drives the hierarchical differentiation process toward pancreatic β-cells. The following diagram illustrates the key signaling interactions throughout the differentiation timeline.
The stepwise differentiation of iPSCs into functional pancreatic β-cells represents a sophisticated recapitulation of developmental processes, offering tremendous potential for diabetes treatment, disease modeling, and drug screening. While current protocols have achieved significant advances in generating glucose-responsive insulin-producing cells, challenges remain in achieving fully mature β-cell phenotypes comparable to primary human islets [4]. Protocol variability across different iPSC lines and the need for more defined culture conditions present ongoing research priorities [4]. As differentiation protocols continue to be refined, stem cell-derived β-cells are poised to transform both therapeutic approaches and our fundamental understanding of diabetes pathophysiology. The integration of emerging technologies including single-cell analysis, 3D bioprinting, and microphysiological systems will further enhance the efficiency and fidelity of these differentiation platforms, accelerating their translation to clinical applications.
The directed differentiation of induced pluripotent stem cells (iPSCs) into functional, glucose-responsive pancreatic beta (β) cells represents a cornerstone of modern regenerative medicine approaches for diabetes treatment [32] [41]. This process meticulously replicates in vivo pancreatic embryogenesis by administering specific biochemical cues in a precise sequence and temporal manner [42] [4]. The efficacy of the resulting insulin-producing cells (IPCs) is fundamentally dependent on the essential components employed: growth factors, small molecules, and meticulously formulated culture media. These components work in concert to activate and inhibit key signaling pathways, guiding cells through developmental stages from pluripotency to mature β cells [42]. This application note details these critical reagents and provides a standardized protocol for generating IPCs, serving as a vital resource for researchers and drug development professionals in the field.
Core Components for iPSC Differentiation
The differentiation process is a multi-stage protocol that transforms iPSCs through sequential developmental intermediates: definitive endoderm (DE), pancreatic progenitor, endocrine progenitor, and finally, mature β cells. Each stage requires a unique combination of components to direct the specific cellular fate.
Critical Growth Factors
Growth factors are signaling proteins that bind to cell surface receptors, activating crucial intracellular pathways for differentiation. The tables below summarize their roles and usage.
Table 1: Key Growth Factors and Their Functions in Beta Cell Differentiation
| Growth Factor | Primary Function & Developmental Stage | Key Signaling Pathway | Typical Concentration |
|---|---|---|---|
| Activin A | Induces definitive endoderm from pluripotent stem cells [42]. | Nodal/TGF-β | 100 ng/mL [42] |
| bFGF (FGF2) | Supports definitive endoderm maintenance; can bias differentiation towards the pancreatic δ-cell lineage when combined with FGF7 [43] [42]. | FGF | Varies by protocol |
| FGF7 | Promotes pancreatic endoderm/progenitor differentiation and expansion [43]. | FGF | 50 ng/mL [43] |
| FGF10 | Confers endocrine identity and promotes proliferation of pancreatic progenitors [42]. | FGF | Varies by protocol |
| EGF (Epidermal Growth Factor) | Used in later stages to support cell growth and maturation [42]. | EGF | Varies by protocol |
| HGF (Hepatocyte Growth Factor) | Used during hepatocyte differentiation; can be part of maturation cocktails in some beta cell protocols [44]. | HGF | Varies by protocol |
Table 2: Growth Factor Application by Differentiation Stage
| Differentiation Stage | Key Growth Factors | Objective |
|---|---|---|
| Definitive Endoderm | Activin A | Specify endodermal lineage [42] |
| Pancreatic Progenitor | FGF7, FGF10, bFGF | Induce pancreatic fate and progenitor expansion [43] [42] |
| Endocrine Progenitor | FGF2, FGF7 | Synergistically promote endocrine commitment and δ-cell specification [43] |
| Beta Cell Maturation | EGF, HGF | Support final maturation and functional acquisition |
Essential Small Molecules
Small molecules are low-mass compounds that can selectively inhibit or activate signaling pathways, offering advantages in cost, stability, and penetration. The following table categorizes these molecules based on their mechanistic role.
Table 3: Key Small Molecules and Their Mechanisms of Action
| Small Molecule | Primary Target/Function | Key Signaling Pathway | Typical Concentration |
|---|---|---|---|
| CHIR99021 | GSK-3β inhibitor; activates Wnt signaling to promote definitive endoderm formation [42]. | Wnt/β-catenin | 2 µM [42] |
| SANT-1 | Hedgehog (Hh) pathway inhibitor; promotes pancreatic progenitor specification [42]. | Hedgehog | Varies by protocol |
| Retinoic Acid | A derivative of Vitamin A; critical for patterning the pancreatic endoderm and β-cell maturation [42]. | Retinoic Acid Receptor | Varies by protocol |
| Vitamin C (Ascorbic Acid) | Acts as an antioxidant and epigenetic modulator; enhances β-cell gene expression and maturation [42]. | Epigenetic Stabilization | Varies by protocol |
| Y-27632 | ROCK inhibitor; enhances cell survival, especially during passaging and initial plating [43]. | ROCK | Varies by protocol |
| Valproic Acid | Histone deacetylase (HDAC) inhibitor; can improve reprogramming and differentiation efficiency [41]. | HDAC | Varies by protocol |
Basal Media and Supplements
The choice of basal media and supplements provides the foundational environment for cell viability and directed differentiation.
Table 4: Common Basal Media and Supplements
| Component | Type | Function & Examples |
|---|---|---|
| Basal Media | Foundation | mTeSR1: Maintains pluripotency pre-differentiation [42]. RPMI, DMEM/F12: Commonly used as base media during differentiation stages, often supplemented with specific factors [45] [44]. |
| Media Supplements | Additives | B27 & N2: Provide hormones, lipids, and other essential components for cell health and differentiation [32] [44]. GlutaMax: A stable source of L-glutamine. Non-Essential Amino Acids (NEAAs): Support cell growth. |
The Scientist's Toolkit: Research Reagent Solutions
The following table compiles essential materials and kits used in the differentiation of iPSCs into beta cells, providing a practical resource for laboratory planning.
Table 5: Essential Research Reagents and Materials for iPSC to Beta Cell Differentiation
| Reagent/Material | Function/Application | Example Product/Component |
|---|---|---|
| Pluripotent Stem Cell Media | Maintenance and expansion of undifferentiated iPSCs. | mTeSR1 [42], STEMdiff Definitive Endoderm Kit [44] |
| Definitive Endoderm Inducer | Directs differentiation from pluripotency to definitive endoderm. | Activin A, CHIR99021 [42] |
| Pancreatic Progenitor Inducers | Drives specification of pancreatic fate from endoderm. | FGF7, FGF10, SANT-1, Retinoic Acid [43] [42] |
| Maturation Factors | Supports final maturation into functional, glucose-responsive beta cells. | Vitamin C, EGF, HGF [44] [42] |
| Cell Survival Supplement | Improves cell survival after passaging, thawing, or during differentiation. | Y-27632 (ROCK inhibitor) [43] |
| Characterization Antibodies | Immunostaining for key markers at each differentiation stage. | Anti-SOX17 (Endoderm), Anti-PDX1 (Pancreatic Progenitor), Anti-NKX6.1, Anti-MafA, Anti-Insulin (Beta Cells) [45] [46] |
| Functional Assay Kits | Measuring functional maturity of derived beta cells. | C-peptide ELISA Kit [46], Human Serum ALBUMIN ELISA Kit [44] |
Standardized Protocol for Beta Cell Differentiation
This protocol outlines a multi-stage, serum-free differentiation of iPSCs into insulin-producing beta cells, integrating key components from recent research.
Stage 0: Pluripotency Maintenance and Preparation
- Objective: Maintain undifferentiated, high-quality iPSCs.
- Procedure:
- Quality Control: Colonies should display tight, distinct borders and a high nucleus-to-cytoplasm ratio. Confirm pluripotency marker expression (OCT4, SOX2, NANOG) via immunostaining.
Stage 1: Definitive Endoderm (DE) Differentiation (Days 0-2)
- Objective: Generate SOX17/FOXA2-positive definitive endoderm cells.
- Basal Medium: RPMI 1640 [45].
- Supplementation:
- Day 0-1: Add 100 ng/mL Activin A and 2 µM CHIR99021 to the basal medium [42].
- Day 1-2: Replace medium with basal medium containing 100 ng/mL Activin A only.
- Expected Outcomes: >80% of cells should express definitive endoderm markers SOX17 and FOXA2, verified by immunostaining or flow cytometry [42].
Stage 2: Pancreatic Progenitor (PP) Induction (Days 3-5)
- Objective: Generate PDX1-positive pancreatic progenitors.
- Basal Medium: DMEM/F12 supplemented with B27 [32] [44].
- Supplementation: Add 50 ng/mL FGF7 [43] and 2 µM Retinoic Acid [42]. Other protocols may include FGF10, SANT-1, and ascorbic acid.
- Expected Outcomes: Emergence of PDX1+ progenitors. Co-expression of PDX1 and NKX6.1 is a key indicator of pancreatic progenitor identity [32] [46].
Stage 3: Endocrine Progenitor (EP) Induction (Days 6-10)
- Objective: Generate NEUROG3/NEUROD1-positive endocrine precursors.
- Basal Medium: DMEM/F12 with B27.
- Supplementation: A combination of 50 ng/mL FGF7 and 50 ng/mL FGF2 (bFGF) can be applied to synergistically promote endocrine differentiation and δ-cell specification [43]. Other factors like SANT-1 and vitamin C are also commonly used.
- Expected Outcomes: Significant upregulation of the endocrine determination factor NEUROG3, along with NEUROD1 [4].
Stage 4: Beta Cell Maturation (Days 11-14+)
- Objective: Generate mature, glucose-responsive β cells expressing MAFA, NKX6.1, and Insulin.
- Basal Medium: DMEM/F12 with B27.
- Supplementation: Add factors to promote terminal maturation, such as Vitamin C (Ascorbic Acid) and Retinoic Acid, which have been shown to lead to overexpression of key β-cell genes [42]. Additional components like EGF, HGF, and ALK5 inhibitors may also be used.
- 3D Culture: For enhanced maturation, transfer cells to low-attachment plates to allow self-organization into 3D islet-like clusters [45].
- Expected Outcomes: Cells should express mature β-cell markers (MAFA, NKX6.1, PDX1, Insulin) and demonstrate glucose-stimulated insulin secretion (GSIS) [46].
Signaling Pathways and Experimental Workflow
The following diagrams visualize the key signaling pathways involved and the sequential experimental workflow.
Key Signaling Pathways in Beta Cell Differentiation
Diagram 1: Key signaling pathways and their targets in differentiation. Pathways are activated by specific molecules to drive transitions between successive cellular stages.
iPSC to Beta Cell Differentiation Workflow
Diagram 2: A simplified four-stage differentiation workflow. The process guides cells from pluripotency through key developmental intermediates to mature, insulin-producing beta cells.
The successful differentiation of iPSCs into functionally mature pancreatic beta cells is a meticulously orchestrated process reliant on the precise application of growth factors, small molecules, and optimized culture media. By recapitulating in vivo development, protocols can generate cells that express key transcription factors such as PDX1, NKX6.1, and MAFA, and exhibit glucose-stimulated insulin secretion [46] [42]. Continued refinement of these essential components—including the exploration of 3D culture systems, mechanical cues, and novel small molecules—is paramount for achieving cells that fully mirror the physiology of human islets [47]. The standardized reagents and protocols detailed herein provide a robust foundation for research aimed at diabetes disease modeling, drug screening, and the advancement of cell replacement therapies.
The differentiation of human induced pluripotent stem cells (iPSCs) into functional, insulin-producing beta cells represents a frontier in diabetes research, with profound implications for disease modeling, drug screening, and cell replacement therapy. A critical factor determining the success of this differentiation is the choice of culture system. While two-dimensional (2D) monolayers have been the traditional workhorse for their simplicity and scalability, three-dimensional (3D) culture systems—including suspension bioreactors and static microwells—are increasingly favored for their ability to mimic the complex spatial architecture and cell-cell interactions found in native pancreatic islets [48] [49]. This application note provides a structured comparison of 2D and 3D culture platforms, detailing their respective protocols, outcomes, and applications within the specific context of generating iPSC-derived beta cells.
System Comparison and Quantitative Outcomes
The selection between 2D and 3D culture systems involves balancing factors such as throughput, cost, biological relevance, and technical complexity. The table below summarizes the core characteristics of each system to guide researchers in making an informed choice.
Table 1: Core Characteristics of 2D vs. 3D Culture Systems for Beta Cell Differentiation
| Feature | 2D Monolayer Culture | 3D Suspension/Microwell Culture |
|---|---|---|
| Spatial Architecture | Flat, monolayer; forced cell polarity on rigid surface [48] | Spatial, multi-layered structures; recapitulates tissue-like organization [48] [49] |
| Cell-Cell & Cell-ECM Interactions | Limited and unnatural [48] | Enhanced; promotes correct cellular polarization and signaling [49] |
| Physiological Relevance | Low; marked changes in cell shape and function, including non-physiological CYP enzyme profiles in hepatocytes [48] | High; better mimics the in vivo microenvironment, including nutrient and oxygen gradients [48] |
| Scalability for Manufacturing | Scales poorly; culture area and labor increase linearly with cell number [50] | Highly scalable using bioreactors; single-batch processes possible from 0.1L to 0.5L scales [39] |
| Throughput & Cost | Ideal for high-throughput screening (e.g., 384/1536-well plates); cost-effective and scalable for repetitive studies [48] | Lower throughput; more expensive, requires specialized equipment and reagents [48] |
| Technical Expertise & Protocols | Simple; many well-established, standardized protocols exist [48] | Demands greater technical expertise; protocols are more complex and less standardized [48] |
| Typical Applications | High-throughput compound screening, mechanistic pathway studies, basic co-culture experiments [48] | Disease modeling requiring microtissues, physiologically-relevant drug testing, long-term culture, transplantation studies [48] |
Beyond their fundamental characteristics, these culture systems yield quantitatively different results in terms of differentiation efficiency, cellular maturity, and functionality. The following table synthesizes key performance metrics from recent studies.
Table 2: Quantitative Outcomes of iPSC to Beta Cell Differentiation in 2D vs. 3D Systems
| Parameter | 2D Monolayer Culture | 3D Suspension Bioreactor | 3D Static Microwell |
|---|---|---|---|
| Differentiation Efficiency/Purity | High batch-to-batch variability in %TNNT2+ cells reported in cardiac differentiation [50] | ~94% TNNT2+ cells in cardiac differentiation; >90% PDX1+/NKX6.1+ pancreatic progenitors reported [50] [39] | Yield of insulin-positive cells comparable to human islets [49] |
| Yield & Scalability | Lower yield in cardiac differentiation; linear scaling [50] | Up to ~1.21 million cells/mL in cardiac differentiation; 12-fold increase in Islet Equivalent Count (IEQ) with 5x reactor scale-up [50] [39] | Controllable yield based on microwell number; suitable for medium-scale production [49] |
| Cellular Maturity | Lower maturity; higher spontaneous beating frequency in cardiomyocytes [50] | Higher maturity markers (e.g., MYH7, MYL2) in cardiomyocytes; enriched β-cell composition (~63% CPPT+NKX6.1+ISL1+) [50] [39] | Requires in vivo transplantation for full functional maturation [49] |
| Functional Response | Declined cytochrome P450 (CYP) activity within days in hepatocytes [48] | Glucose-responsive insulin release (3.9–6.1-fold increase); reversed diabetes in mice [39] | Limited insulin secretion in vitro; acquires full responsiveness to secretagogues after in vivo transplantation [49] |
| Structural Control & Homogeneity | High homogeneity in a monolayer | Heterogeneous aggregate size; potential for clumping in rotating suspension [49] | Homogeneously small-sized islet-like aggregates [49] |
Experimental Protocols for 3D Culture Systems
Protocol 1: Scalable Differentiation in Stirred Suspension Bioreactors
This protocol is adapted for generating large quantities of pancreatic islet-like clusters using a Vertical Wheel (VW) bioreactor system, enabling a single-vessel, single-batch process from iPSC expansion to mature SC-islets [39].
Key Reagent Solutions:
- Aphidicolin (APH): A cell growth inhibitor used in the final stages of differentiation to mitigate the risk of off-target cell populations and reduce cellular heterogeneity [39].
- Small Molecule Induction: Utilizes defined small molecules and growth factors to guide differentiation through definitive endoderm, pancreatic progenitor, and endocrine stages.
Workflow Diagram:
Differentiation Stages:
- iPSC Expansion and Aggregation: Expand iPSCs in a VW bioreactor to form uniform 3D clusters with a target average diameter of 250 µm. High-quality input cells are critical for success [50] [39].
- Definitive Endoderm Formation: Induce the formation of definitive endoderm using specific growth factors like Activin A, building on established, multi-stage protocols [1] [49].
- Pancreatic Progenitor Specification: Guide endodermal cells into pancreatic progenitors. Efficiency can exceed 90% for PDX1+/NKX6.1+ cells, key markers for pancreatic fate [39].
- Endocrine Differentiation and Maturation: Further differentiate progenitors into endocrine cells, incorporating aphidicolin (APH) in the final maturation phase to inhibit proliferating off-target cells and enhance endocrine purity. The total process takes 27 days [39].
Protocol 2: Controlled Aggregation in Static Microwell Platforms
This protocol utilizes AggreWell plates to generate highly uniform, small-sized islet-like organoids, offering superior experimental success rate and reproducibility for in-depth in vitro and in vivo studies [49].
Key Reagent Solutions:
- AggreWell Plates: Microwell plates designed to control the initial size of cell aggregates. Seeding at 750 cells/microwell is a standard starting point [49].
- ROCK Inhibitor (Y-27632): Added to the medium during aggregate formation to inhibit apoptosis and improve cell viability after dissociation [49].
- Extracellular Matrix (ECM): Initial differentiation stages may be performed on Matrigel-coated plates to support cell growth and patterning [49].
Workflow Diagram:
Differentiation Stages:
- Monolayer Culture (Stages 1-4): Differentiate confluent iPSCs in 2D, Matrigel-coated wells through the definitive endoderm and pancreatic progenitor stages [49].
- 3D Aggregation (Stage 4): Detach the cells at the progenitor stage, resuspend them in medium containing ROCK inhibitor, and seed them into AggreWell plates at a density of 750 cells per microwell to form uniformly sized aggregates [49].
- Suspension Culture (Stages 5-7): Transfer the aggregates to suspension culture (e.g., Petri dishes) or maintain them in the microwell system to complete the final stages of endocrine differentiation and maturation into islet-like organoids [49].
- In Vivo Maturation (Optional): For full functional maturation, transplant the aggregates into an in vivo model, such as under the kidney capsule of immunodeficient mice. The in vivo environment provides critical signals for the cells to acquire robust glucose-responsive insulin secretion [49].
The Scientist's Toolkit: Essential Research Reagents
Successful differentiation relies on a core set of reagents, each playing a specific role in guiding cell fate. The following table lists key solutions used in the protocols cited in this note.
Table 3: Key Reagent Solutions for iPSC to Beta Cell Differentiation
| Reagent | Function / Purpose | Example Protocol Context |
|---|---|---|
| CHIR99021 | A GSK-3β inhibitor that activates Wnt signaling; used to initiate mesendoderm/definitive endoderm differentiation. | Used in the first stage of differentiation in both bioreactor and monolayer protocols [50]. |
| Activin A | A TGF-β family growth factor used to direct pluripotent cells toward the definitive endoderm lineage. | Component of definitive endoderm induction media [51] [52]. |
| ROCK Inhibitor (Y-27632) | Enhances cell survival after passaging and during single-cell aggregation, reducing apoptosis. | Added during the seeding of cells into 3D aggregation systems like microwells [51] [49]. |
| Aphidicolin (APH) | A cell cycle inhibitor; used in the final stages of differentiation to reduce proliferation of off-target cells and enhance endocrine purity. | Incorporated during SC-islet maturation in bioreactor protocols to minimize cellular heterogeneity [39]. |
| LDN-193189 | A small molecule inhibitor of BMP signaling; promotes endodermal and pancreatic patterning. | Used in protocols for differentiating stem cells into pancreatic alpha cells [51]. |
| Retinoic Acid (RA) | A potent morphogen that promotes pancreatic specification and endocrine differentiation. | A key component in many protocols for patterning pancreatic progenitors [51]. |
| Matrigel | A complex basement membrane extract; provides a natural scaffold for 2D culture and initial differentiation stages that supports cell attachment and signaling. | Used for coating culture vessels during the early stages of differentiation [49]. |
| AggreWell Plates | Microwell plates designed to force cells into uniformly sized aggregates, ensuring reproducibility in 3D organoid formation. | Used to generate homogeneously small-sized islet-like aggregates from dissociated progenitor cells [49]. |
Both 2D and 3D culture systems offer distinct advantages for researchers developing iPSC-derived beta cells. The choice is not a matter of which is universally superior, but which is most appropriate for the specific research goal. 2D monolayers remain the system of choice for high-throughput applications where cost, speed, and simplicity are paramount. In contrast, 3D systems—including scalable bioreactors and controlled microwell platforms—are indispensable for generating the physiologically relevant, spatially organized cells required for predictive disease modeling, reliable drug testing, and ultimately, cell replacement therapies for diabetes. As the field progresses, the refinement of 3D protocols, particularly in enhancing scalability and consistency, will be crucial for translating this promising technology into clinical and industrial applications.
Applications in Disease Modeling for Type 1 and Type 2 Diabetes
Induced pluripotent stem cell (iPSC) technology has revolutionized the study of human diseases, offering an unprecedented platform for modeling diabetes pathogenesis in vitro. By enabling the generation of patient-specific insulin-producing beta cells, iPSCs provide a powerful tool for elucidating disease mechanisms, screening therapeutic compounds, and developing personalized treatment approaches for both type 1 (T1D) and type 2 diabetes (T2D) [12] [53]. The core principle involves reprogramming somatic cells from diabetic patients into a pluripotent state, then differentiating these iPSCs into pancreatic beta cells that retain the donor's genetic and epigenetic background [12]. This approach allows researchers to recapitulate key aspects of diabetes pathology in culture dishes, creating human-relevant models that overcome the limitations of animal studies and primary human tissue scarcity.
iPSC-Derived Beta Cells for Diabetes Modeling
Generation of Disease-Specific iPSCs
The first critical step in diabetes disease modeling involves generating patient-specific iPSCs. Somatic cells, typically dermal fibroblasts or peripheral blood mononuclear cells, are collected from donors with T1D, T2D, or healthy controls [53]. These cells are then reprogrammed into a pluripotent state through the introduction of specific transcription factors, most commonly the Yamanaka factors (OCT4, SOX2, KLF4, and c-MYC) [12] [53].
Table 1: iPSC Reprogramming Methods for Diabetes Research
| Method | Mechanism | Advantages | Disadvantages | Efficiency |
|---|---|---|---|---|
| Viral (Retro/Lentivirus) | Genomic integration of reprogramming factors | High efficiency; well-established | Risk of insertional mutagenesis; oncogene reactivation | 0.1%-1% [53] |
| Non-integrating Viral (Sendai) | Episomal replication without integration | No genomic integration; high efficiency | Requires careful clearance of viral remnants | ~0.1% [53] |
| Episomal Plasmads | Non-integrating plasmid vectors | Virus-free; minimal integration risk | Lower efficiency; requires multiple transfections | 0.001%-0.01% [53] |
| Small Molecule | Chemical induction of pluripotency | No genetic manipulation; cost-effective | Complex optimization; variable results | Varies by cocktail [12] |
Following reprogramming, iPSC clones are rigorously characterized for pluripotency through assessment of marker expression (OCT4, NANOG, SSEA-4), karyotyping to ensure genomic integrity, and functional assays such as embryoid body formation and teratoma assays [53]. Fully characterized iPSC lines can then be banked and used for differentiation into pancreatic lineage cells.
Differentiation into Insulin-Producing Beta Cells
The differentiation of iPSCs into functional beta-like cells follows a stepwise protocol that recapitulates embryonic pancreatic development [10] [53]. This multi-stage process directs cells through definitive endoderm, pancreatic progenitor, endocrine progenitor, and finally mature beta-like cell stages, with specific signaling molecules and growth factors added at each transition.
Experimental Protocol: iPSC to Beta-Cell Differentiation
- Base Medium: Use RPMI 1640 or DMEM with B-27 supplement (without vitamin A for specific stages)
- Stage 1: Definitive Endoderm (3-4 days)
- Add 100 ng/mL Activin A
- Add 3 μM CHIR99021 (GSK-3β inhibitor)
- Quality Control: Assess expression of SOX17 and FOXA2 by immunostaining (>85% efficiency target) [10]
- Stage 2: Pancreatic Progenitor (3-4 days)
- Add 50 ng/mL FGF10
- Add 0.25 μM Sant-1 (Hedgehog pathway inhibitor)
- Add 1 μM Retinoic Acid
- Add 100 ng/mL Noggin (BMP signaling inhibitor)
- Quality Control: Verify PDX1 and NKX6.1 co-expression (>70% efficiency target) [10]
- Stage 3: Endocrine Progenitor (4-5 days)
- Add 1 μM XXI (Notch inhibitor)
- Add 50 ng/mL Noggin
- Add 10 ng/mL BMP4 (context-dependent)
- Quality Control: Assess NGN3 and NEUROD expression
- Stage 4: Beta Cell Maturation (14-21 days)
- Add 10 μM Alk5iII (TGF-β inhibitor)
- Add 10 μg/mL Heparin
- Add 10 mM Nicotinamide
- Quality Control: Measure insulin content, C-peptide secretion, and response to glucose stimulation [10]
The entire differentiation process typically requires 25-35 days, with the maturation phase being particularly critical for acquiring full functionality. The resulting beta-like cells should express key markers including PDX1, NKX6.1, MAFA, and insulin, and demonstrate glucose-stimulated insulin secretion [10].
Figure 1: iPSC Differentiation Workflow to Beta-like Cells. The process mimics embryonic pancreatic development through sequential stages with specific signaling molecules.
Disease Modeling Applications
Type 1 Diabetes Modeling
iPSC-based T1D models primarily focus on recapitulating the autoimmune destruction of pancreatic beta cells. Patient-derived iPSCs capture the genetic susceptibility elements of T1D, including polymorphisms in HLA, INS, CTLA-4, and PTPN22 genes [54]. These models enable the investigation of early events in disease pathogenesis, including how genetic variants contribute to increased beta cell vulnerability to immune attack.
Key Applications:
- Autoimmune Interaction Studies: Co-culture iPSC-derived beta cells with autologous immune cells (T-cells) to investigate cell-mediated destruction mechanisms [53]
- Genetic Vulnerability Screening: Identify gene expression patterns and cellular phenotypes that predispose beta cells to immune recognition and attack
- Immunomodulatory Therapy Testing: Screen drugs that protect beta cells from immune destruction or modulate autoimmune responses [54]
These models are particularly valuable because they permit the study of human-specific immune interactions that cannot be fully recapitulated in animal models, potentially revealing novel therapeutic targets for preserving beta cell mass in pre-diabetic individuals.
Type 2 Diabetes Modeling
iPSC-based T2D models emphasize the metabolic aspects of the disease, including beta cell dysfunction in the context of insulin resistance. These models capture the polygenic nature of T2D, with patient-derived cells containing the complex genetic background that contributes to disease susceptibility [55].
Table 2: T2D Phenotypes Modeled with iPSC-Derived Beta Cells
| Phenotypic Category | Specific Defects | Assessment Methods | Therapeutic Screening Applications |
|---|---|---|---|
| Insulin Secretion | Reduced glucose sensitivity; Impaired first-phase secretion; Altered proinsulin processing | Glucose-stimulated insulin secretion; DR-E-P model analysis [56] | Insulin secretagogues; GLP-1 receptor agonists |
| Beta Cell Survival | Increased apoptosis under metabolic stress; ER stress susceptibility; Oxidative stress vulnerability | TUNEL assay; Caspase-3 activation; CHOP expression [57] | ER stress reducers; Antioxidants; Apoptosis inhibitors |
| Genetic Function | Impaired mitochondrial function; Altered gene regulatory networks; Protein misfolding | Respiration assays; RNA-seq; Electrophysiology [55] | Metabolic modulators; Gene expression modifiers |
| Cell Identity | Loss of mature beta cell markers; Dedifferentiation | Immunostaining for PDX1, NKX6.1, MAFA; Single-cell RNA-seq [55] | Differentiation stabilizers; Maturation promoters |
T2D modeling often involves challenging iPSC-derived beta cells with metabolic stressors such as high glucose, free fatty acids, or inflammatory cytokines to mimic the in vivo diabetic environment [57] [55]. This approach allows researchers to study how genetic susceptibility interacts with environmental factors to drive disease progression.
Advanced Protocol: Epigenetic Modulation to Enhance Differentiation
Recent research has highlighted the critical role of epigenetic regulation in beta cell differentiation and function. The histone demethylase KDM4A has been identified as a key facilitator of endocrine differentiation through its regulation of H3K9me3 levels [10].
Detailed Protocol: Assessing KDM4A Function in Beta Cell Differentiation
- Objective: To evaluate the effect of KDM4A knockdown on pancreatic differentiation efficiency
- Experimental Groups: (1) Wild-type iPSCs, (2) KDM4A-knockdown iPSCs
- Knockdown Method: Lentiviral transduction with shRNA targeting KDM4A (sequence: CCGGGCAGTTACAAGTATGACAAACTCGAGTTTGTCATACTTGTAACTGCTTTTTG) [10]
- Differentiation Conditions: Follow standard differentiation protocol with doxycycline induction (1 μg/mL) maintained throughout for knockdown groups
- Readouts and Analyses:
- Gene Expression: RT-qPCR for PDX1, NKX6.1, INS (expected ~50% reduction in KDM4A-deficient cells) [10]
- Protein Analysis: Western blot for KDM4A, PDX1, NKX6.1, insulin
- Functional Assessment: Glucose-stimulated insulin secretion (expected ~80% reduction in secretion) [10]
- Epigenetic Analysis: Chromatin immunoprecipitation for H3K9me3 at pancreatic gene promoters
- Interpretation: Successful differentiation requires KDM4A-mediated removal of repressive H3K9me3 marks at key pancreatic gene loci
This protocol demonstrates how manipulating epigenetic regulators can enhance our understanding of beta cell development and potentially improve differentiation efficiency for therapeutic applications.
The Scientist's Toolkit: Essential Research Reagents
Table 3: Key Reagents for iPSC-Derived Beta Cell Research
| Reagent Category | Specific Examples | Function | Application Notes |
|---|---|---|---|
| Reprogramming Factors | OCT4, SOX2, KLF4, c-MYC (Yamanaka factors) | Induction of pluripotency | Multiple delivery methods available; consider genomic integration risks [12] [53] |
| Differentiation Factors | Activin A, CHIR99021, FGF10, Retinoic Acid, Noggin | Directed differentiation through pancreatic lineage | Stage-specific combinations required; concentration and timing critical [10] [53] |
| Culture Matrices | Vitronectin, Matrigel, Laminin-521 | iPSC attachment and survival | Feeder-free systems preferred for clinical applications [53] |
| Cell Culture Media | mTeSR1, Essential 8 (iPSC maintenance); Stage-specific differentiation media | Support cell growth and directed differentiation | Serum-free formulations enhance reproducibility [10] [53] |
| Characterization Antibodies | Anti-OCT4, SOX17, FOXA2, PDX1, NKX6.1, Insulin, C-peptide | Lineage tracking and quality control | Essential for monitoring differentiation efficiency at each stage [10] |
| Functional Assay Reagents | Glucose solutions (2mM vs. 20mM), ELISA kits for insulin/C-peptide | Assessment of beta cell function | Glucose-stimulated insulin secretion is gold standard functionality test [10] |
Quantitative Analysis of Beta Cell Function
Robust functional assessment is crucial for validating iPSC-derived beta cell models. The DR-E-P model provides a comprehensive framework for analyzing insulin secretion dynamics during glucose tolerance tests [56].
Table 4: DR-E-P Model Parameters for Beta Cell Function Quantification
| Parameter | Definition | Physiological Correlation | Typical Values in Health vs. Diabetes |
|---|---|---|---|
| Glucose Sensitivity (GSENS) | Slope of dose-response relationship between glucose concentration and insulin secretion | Beta cell responsiveness to glucose levels | Normal: ~60-120 pmol/min·m²·mM [56] T2D: Markedly reduced, can decline to <30 pmol/min·m²·mM [56] |
| Rate Sensitivity (RSENS) | Dependence of insulin secretion on rate of glucose increase | First-phase insulin secretion capacity | Normal: ~600-1500 pmol/m²·mM [56] T2D: Impaired, particularly in advanced disease [56] |
| Potentiation Factor Ratio (PFR) | Ratio of potentiation factors at end vs. start of test | Beta cell priming during sustained stimulation | Normal: ~1.2-2.0 [56] T2D: Often reduced, indicating impaired adaptive response [56] |
This modeling approach offers significant advantages over simple static indices like the insulinogenic index, providing more refined insights into specific defects in beta cell function that occur in different stages of diabetes pathogenesis [56].
iPSC-based disease modeling has fundamentally transformed diabetes research by providing unlimited sources of human beta cells with disease-relevant genetic backgrounds. The protocols and applications outlined in this document enable researchers to create sophisticated in vitro models of both T1D and T2D, facilitating the investigation of disease mechanisms, genetic vulnerability, and therapeutic interventions. As differentiation protocols continue to improve through insights into epigenetic regulation and other determining factors, and as functional assessment methods become more refined, these models will play an increasingly central role in advancing our understanding of diabetes pathogenesis and accelerating the development of novel therapeutics. The integration of patient-specific iPSCs with emerging technologies like gene editing, organoid culture, and automated screening platforms promises to further enhance the relevance and throughput of these powerful disease models.
Drug Screening and Toxicity Testing Using Patient-Specific iPSC-Derived Beta Cells
The generation of induced pluripotent stem cells (iPSCs) has fundamentally transformed biomedical research, providing a platform to circumvent the ethical and immunological challenges associated with embryonic stem cells (ESCs) [58]. This technology enables the reprogramming of patient-specific somatic cells into pluripotent stem cells, which can subsequently be differentiated into various somatic cell types, including pancreatic beta cells [12]. For diabetes research and drug development, the ability to generate an unlimited supply of patient-specific beta cells presents unprecedented opportunities [5]. These iPSC-derived beta cells serve as physiologically relevant in vitro models for elucidating disease mechanisms, performing high-throughput drug screening, and assessing compound toxicity [58] [3]. Furthermore, patient-specific iPSC-derived beta cells capture the genetic background of diabetes patients, enabling the development of personalized medicine approaches and the study of patient-specific drug responses [59] [5]. This application note details standardized protocols for the differentiation of patient-specific iPSCs into functional beta cells and their application in drug screening and toxicity testing, framed within the broader context of advancing diabetes research and therapy.
iPSC Differentiation into Pancreatic Beta Cells
The differentiation of human iPSCs into insulin-producing beta cells follows a stepwise protocol that recapitulates in vivo pancreatic development [32]. This process requires guiding cells through definitive endoderm, primitive gut tube, pancreatic progenitor, endocrine progenitor, and finally mature beta cell stages, with each transition controlled by specific signaling molecules and growth factors [6] [32].
Detailed Differentiation Protocol
This protocol is adapted from established methods with modifications to enhance functional maturation [59] [6]. All differentiation stages are performed in a humidified incubator at 37°C with 5% CO₂.
3D Aggregation and Culture
For enhanced functionality, endocrine cells are aggregated into 3D islet-like structures during the final maturation stages (from Day 12 onward) [6]. Two primary methods can be employed:
Functional Characterization of iPSC-Derived Beta Cells
Molecular Characterization
Comprehensive molecular characterization is essential to validate the successful differentiation of iPSCs into beta cells. The following analyses should be performed:
- Immunofluorescence Staining: Fix cells with 4% paraformaldehyde for 15-20 minutes, permeabilize with 0.5% Triton X-100, and block with appropriate serum. Incubate with primary antibodies against key markers (Table 1) for 3 hours at room temperature or overnight at 4°C, followed by appropriate secondary antibodies [6].
- Flow Cytometry (FCM): Dissociate cells to single-cell suspension using Accutase or Accumax. Fix, permeabilize, and stain with antibodies conjugated to fluorescent markers. Analyze using flow cytometer to quantify percentage of positive cells for specific markers [59].
- Quantitative PCR (qPCR): Extract RNA using magnetic bead-based systems. Perform reverse transcription and quantitative PCR using primers for beta cell markers (PDX1, NKX6.1, MAFA, insulin, glucagon, somatostatin) and reference genes (GAPDH, ACTB) [6]. Calculate relative expression using the ΔΔCt method.
Functional Maturity Assessment
The functional maturity of iPSC-derived beta cells is assessed through dynamic insulin secretion assays that evaluate glucose responsiveness:
Application in Drug Screening and Toxicity Testing
High-Throughput Compound Screening
Patient-specific iPSC-derived beta cells enable disease modeling and drug screening for both monogenic and complex forms of diabetes. The following workflow is recommended for high-throughput applications:
Toxicity Testing Applications
iPSC-derived beta cells provide a human-relevant platform for assessing compound toxicity. Key applications include:
- Drug-Induced Beta Cell Toxicity: Evaluate the toxic effects of pharmaceuticals known to impair beta cell function (e.g., certain antipsychotics, immunosuppressants, antivirals).
- Environmental Toxicant Screening: Assess impact of environmental chemicals and pollutants on beta cell viability and function.
- Mechanistic Toxicity Studies: Investigate specific toxicity pathways including oxidative stress, endoplasmic reticulum stress, and mitochondrial dysfunction.
Research Reagent Solutions
Patient-specific iPSC-derived beta cells represent a transformative technology for diabetes research, drug discovery, and toxicity testing. The protocols detailed in this application note provide a standardized framework for generating functionally mature beta cells that can be applied in high-throughput screening platforms. The ability to model different forms of diabetes using patient-specific cells enables unprecedented opportunities for personalized medicine approaches and the development of more effective, safer therapeutics for diabetes. As differentiation protocols continue to improve and the technology becomes more widely adopted, iPSC-derived beta cells are poised to become an indispensable tool in pharmaceutical development and toxicity assessment.
The differentiation of induced pluripotent stem cells (iPSCs) into insulin-producing beta cells represents a transformative approach for treating diabetes, particularly type 1 diabetes (T1D). This field has progressed from foundational in vitro studies to pioneering clinical trials that assess the safety and efficacy of stem cell-derived pancreatic cells [2] [1]. These trials aim to address the critical limitations of current diabetes treatments—specifically, the scarcity of donor pancreata for islet transplantation and the need for lifelong immunosuppression [59]. By generating an unlimited supply of functional beta cells in vitro, researchers hope to develop a curative therapy that restores physiological insulin secretion and glucose homeostasis [61]. This application note provides a comprehensive overview of the current clinical landscape, detailing key trial outcomes, experimental protocols, and essential reagents driving this innovative therapeutic strategy.
Key Clinical Trial Outcomes and Progress
Recent clinical trials have demonstrated the potential of stem cell-derived beta cells to restore endogenous insulin production in individuals with T1D. The following table summarizes quantitative outcomes from seminal studies, highlighting the progression of this therapy from concept to clinical reality.
Table 1: Key Outcomes from Recent Clinical Trials of Stem Cell-Derived Beta Cell Therapies
| Therapy / Trial | Cell Type & Delivery | Patient Outcome | C-peptide Levels | Glycemic Control | Reference |
|---|---|---|---|---|---|
| Chemically induced iPSC Islets | Autologous CiPSC-derived islets; Abdominal anterior rectus sheath transplantation | Insulin independence achieved from day 75, sustained at 1-year follow-up. All safety endpoints met. | Data not specified in abstract; achievement of insulin independence implies functional C-peptide. | Time-in-range (TIR): Increased to >98%; HbA1c: ~5%. | [62] |
| PEC-Direct (ViaCyte) | ESC-derived pancreatic progenitors; subcutaneous macro-enclosure with perforated membranes | 3 of 10 recipients achieved metabolic relevance; 1 patient with highest response shown. | ≥0.1 nmol/L in 3/10 patients (month 6); Peak: 0.23 nmol/L. | TIR: 55% → 85%; Reduced insulin dosing. | [63] |
| Patient-specific iPSC-derived β-cells | T1D-iPSC derived β-like cells; sub-renal capsule in diabetic mice (preclinical) | Restoration of β-cell function; proof-of-concept for autologous therapy. | Detection of insulin secretion in vivo. | Improved blood glucose levels in murine model. | [59] |
The data from these trials confirm the scientific feasibility of generating functional insulin-producing cells from pluripotent stem cells. The reported success in achieving insulin independence in a patient receiving autologous CiPSC-derived islets marks a significant milestone in the field [62]. Furthermore, the detection of stimulated C-peptide levels exceeding 0.1 nmol/L in recipients of allogeneic PEC-Direct products provides robust evidence that stem cell-derived grafts can secrete physiologically relevant amounts of insulin in humans [63]. These outcomes collectively underscore a paradigm shift from managing diabetes with exogenous insulin to potentially curing it through cellular replacement.
Detailed Experimental Protocols
Protocol 1: Generation and Differentiation of Patient-Specific iPSCs
This protocol, adapted from a 2025 study, details the reprogramming of peripheral blood mononuclear cells (PBMCs) from a T1D patient into functional β-like cells [59].
Step 1: Isolation of T1D-PBMCs
- Procedure: Collect blood samples from T1D patients into sodium citrate tubes. Isolate PBMCs using density gradient centrifugation (e.g., with Vacutainer CPT tubes). Quantify and cryopreserve cells in liquid nitrogen.
- Critical Notes: All patient material collection must adhere to ethical guidelines and institutional review board approvals.
Step 2: Reprogramming to T1D-iPSCs
- Procedure: Use an episomal vector-based system for footprint-free reprogramming. The system typically includes plasmids pCXLE-hSK, pCXLE-hUL, pCXLE-hOCT3/4-shp53, and pCXWB-EBNA1.
- Electroporation: Transfect PBMCs using a nucleofector device. Pre-coat culture plates with fibronectin and use CD34+ cell culture methods to enhance survival post-electroporation.
- Culture: Maintain transfected cells in essential medium like StemSpan SFEM supplemented with cytokines (SCF, FLT-3 ligand, IL-3, IL-6) until iPSC colonies emerge. Then transfer to standard human pluripotent stem cell culture conditions.
Step 3: Pluripotency Validation
- Flow Cytometry & qRT-PCR: Confirm expression of core pluripotency markers (OCT4, SOX2, NANOG).
- Genomic Stability Analysis: Perform karyotyping to ensure genomic integrity.
- In Vivo Teratoma Assay: Differentiate iPSCs in immunodeficient mice to confirm formation of tissues from all three germ layers.
Step 4: Directed Differentiation to Pancreatic β-cells
- Overview: This multi-stage process mimics in vivo pancreatic development, directing cells through definitive endoderm, primitive gut tube, pancreatic progenitor, and endocrine progenitor stages, finally maturing into β-like cells.
- Optimization: The protocol was enhanced using a combination of triiodothyronine (T3), vitamin C (Vc), and an M3C adenovirus encoding key transcription factors Pdx1, Ngn3, and MafA.
- M3C Adenovirus Production: Produce adenovirus in 293A cells using Lipofectamine 3000, then concentrate using a purification kit (e.g., Vivapure AdenoPACK).
Step 5: Functional Characterization
- Immunofluorescence & Flow Cytometry: Assess the presence of insulin and other β-cell markers (PDX1, NKX6.1, MAFA).
- qRT-PCR: Quantify expression of key genes (INS, PDX1, NKX6.1, GLUT2, MAFA).
- Glucose-Stimulated Insulin Secretion (GSIS) Assay: Challenge the differentiated cells with low and high glucose concentrations to measure dynamic insulin secretion. A failure to respond appropriately to glucose, as noted in the study, indicates functional immaturity [59].
Diagram 1: iPSC to Beta Cell Workflow. This diagram illustrates the comprehensive experimental workflow for generating and validating patient-specific insulin-producing beta cells from iPSCs, as described in the protocol [59].
Protocol 2: Clinical Encapsulation and Transplantation
This protocol is based on the PEC-Direct trial, which uses encapsulated pancreatic endoderm cells derived from human embryonic stem cells (ESCs) [63].
Step 1: Generation of Pancreatic Progenitors
- Procedure: Differentiate a clinical-grade human ESC line (e.g., CyT49) into PEC-01 cells, a pancreatic endoderm population, using a directed differentiation protocol. This involves sequential exposure to growth factors and small molecules that mirror embryonic pancreatic development.
Step 2: Device Loading and Encapsulation
- Device Type: Use macro-encapsulation devices with perforated membranes. The perforations allow host blood vessels to grow near the cells (improving survival) but necessitate immunosuppression to prevent immune rejection.
- Cell Seeding: Load a high dose of cells (e.g., ~75 million PEC-01 cells per large device) into the encapsulation units.
- Sentinel Devices: Implant smaller, retrievable devices alongside the main implants for post-transplantation analysis.
Step 3: Implantation and Immunosuppression
- Surgical Site: Implant the devices subcutaneously.
- Immunosuppression Regimen: Induce immunosuppression with anti-thymocyte globulin. Maintain it with a combination of mycophenolate mofetil and tacrolimus to protect the allogeneic graft.
Step 4: Post-Transplantation Monitoring
- Primary Efficacy Endpoint: Measure meal-stimulated plasma C-peptide levels at month 6 post-transplantation. A level above the limit of detection (e.g., >0.03 nmol/L) is considered a positive outcome.
- Secondary Endpoints:
- Glycemic Control: Assess continuous glucose monitoring (CGM) metrics, including time-in-range (TIR: 71-180 mg/dL), time-above-range (TAR), and time-below-range (TBR).
- Insulin Use: Track daily exogenous insulin requirements.
- Safety: Monitor for treatment-emergent adverse events (TEAEs) and serious adverse events (TESAEs).
Signaling Pathways in Beta-Cell Differentiation and Maturation
The directed differentiation of iPSCs into functional beta cells requires precise activation and inhibition of key developmental signaling pathways. The following diagram and table outline the core pathways manipulated in vitro to recapitulate in vivo pancreatic development.
Diagram 2: Key Differentiation Signaling Pathways. This diagram visualizes the primary signaling pathways that are sequentially modulated to direct pluripotent stem cells through key developmental stages toward mature beta cells [1] [64].
Table 2: Key Signaling Pathways in Pancreatic Beta-Cell Differentiation
| Pathway / Factor | Stage of Action | Primary Function in Differentiation | Common Modulators Used In Vitro |
|---|---|---|---|
| Activin/Nodal | Definitive Endoderm | Induces formation of definitive endoderm, the germ layer that gives rise to the pancreas. | Activin A, GDF11 [64] |
| Retinoic Acid (RA) | Primitive Gut Tube → Pancreatic Progenitor | Patterns the primitive gut tube towards a pancreatic fate. | Retinoic Acid |
| TGF-β/SMAD Inhibition | Pancreatic Progenitor | Promotes the specification of pancreatic progenitors and prevents differentiation into other lineages. | ALK5 inhibitors (e.g., SB431542) |
| Notch Inhibition | Pancreatic Progenitor → Endocrine Progenitor | Triggers endocrine differentiation by allowing expression of the master regulator NGN3. | Gamma-secretase inhibitors (e.g., DAPT) |
| Thyroid Hormone (T3) | β-cell Maturation | Drives the final functional maturation of beta cells, enhancing insulin content and glucose responsiveness. | Triiodothyronine (T3) [59] |
| cAMP Signaling | β-cell Maturation | Enhances the expression of key beta-cell transcription factors and promotes glucose-stimulated insulin secretion. | cAMP inducers |
The Scientist's Toolkit: Essential Research Reagents
The following table catalogs crucial reagents and materials used in the featured protocols for generating and characterizing iPSC-derived beta cells.
Table 3: Essential Reagents for iPSC-Derived Beta Cell Research
| Reagent / Material | Function / Application | Example from Literature |
|---|---|---|
| Episomal Vectors | Non-integrating reprogramming of somatic cells into iPSCs, avoiding genomic modification. | pCXLE-based episomal plasmids (Addgene #27077, #27078, #27080, #37624) [59]. |
| M3C Adenovirus | Co-expression of key transcription factors (PDX1, NGN3, MAFA) to enhance beta-cell maturation. | Adenovirus M3C (Addgene #61041) used in final maturation stage [59]. |
| Triiodothyronine (T3) | Thyroid hormone used to promote the functional maturation of immature beta-like cells. | Optimization of differentiation protocol [59]. |
| Vitamin C (Vc) | Acts as an antioxidant and epigenetic modulator to improve differentiation efficiency and cell survival. | Used in combination with T3 to improve β-cell differentiation [59]. |
| PEC-01 Cells | A well-characterized pancreatic endoderm cell population derived from human ESCs for transplantation. | Differentiated from CyT49 hESC line; used in PEC-Direct clinical trials [63]. |
| Macro-encapsulation Device | A cell-containing delivery vehicle that allows vascularization while providing a physical barrier. | Perforated membrane devices used in PEC-Direct trials [63]. |
| Anti-thymocyte Globulin | Immunosuppressive agent used for induction therapy in allogeneic transplant recipients. | Part of the immunosuppression regimen in PEC-Direct trial [63]. |
The clinical translation of iPSC-derived beta cell therapies is underway, with early-phase trials already demonstrating proof-of-concept that these cells can secrete insulin and improve glycemic control in patients with T1D [62] [63]. The field is now navigating the "last mile" challenges, which include optimizing cell maturation, ensuring long-term graft survival and function, developing effective immune protection strategies without chronic immunosuppression, and creating scalable and cost-effective manufacturing processes [65]. As protocols are refined and our understanding of pancreatic development deepens, stem cell-based therapies are poised to progress from a promising experimental treatment to a potentially curative option for diabetes.
Navigating Challenges and Enhancing Efficiency in Beta Cell Generation
The differentiation of human induced pluripotent stem cells (hiPSCs) into insulin-producing beta cells represents a transformative strategy for disease modeling and cell replacement therapy for diabetes [32] [61]. Despite significant advances in protocol development, the functional immaturity of in vitro-derived beta cells remains a primary obstacle to their clinical application [66]. These cells often lack the robust glucose-stimulated insulin secretion (GSIS) response, proper glucose threshold sensitivity, and mature mitochondrial metabolic activity characteristic of primary adult human beta cells [67] [66].
This Application Note examines the comparative maturation capacity of in vitro versus in vivo environments for hiPSC-derived pancreatic beta cells. We provide detailed protocols and quantitative analyses to guide researchers in addressing the critical challenge of functional immaturity, framed within the broader context of advancing iPSC-based diabetes research.
Quantitative Comparison of Maturation States
The functional maturity of stem cell-derived islets (SC-islets) can be quantified across multiple parameters. The table below benchmarks key characteristics of in vitro-differentiated cells against primary human islets and in vivo-matured grafts.
Table 1: Functional Maturation Parameters of SC-Islets Across Conditions
| Parameter | Early In Vitro (S7w0) | Late In Vitro (S7w6) | Post-Engraftment (6 Months) | Primary Human Islets |
|---|---|---|---|---|
| Glucose Sensitivity Threshold | No response to high glucose [67] | ~8.1 mM (half-maximal response) [67] | ~5-6 mM (adult threshold) [67] | ~5-6 mM [67] |
| Insulin Secretion Profile | No biphasic pattern; high basal leakage [67] | Developing biphasic pattern [67] | Robust biphasic response [67] | Tightly controlled biphasic response [67] |
| Monohormonal INS+ Cells | ~40% [67] | ~40% (stable proportion) [67] | Increased monohormonal purity post-engraftment [49] | >99% [67] |
| Polyhormonal INS+GCG+ Cells | 15-20% [67] | <5% [67] | Minimal polyhormonal cells [49] | <1% [67] |
| Transcriptional Similarity to Primary Islets | Low (fetal-like profile) [67] | Intermediate [67] | High (closely resembles primary islets) [67] | Reference standard |
| Proliferation Rate (Ki-67+ INS+ cells) | 2.1% [67] | 0.46% (with ZM) [67] | Minimal post-engraftment [67] | <0.1% in adults [67] |
Experimental Protocols
In Vitro Maturation Protocol
This optimized 7-stage protocol generates functionally mature SC-islets with advanced characteristics [67] [66].
Table 2: Seven-Stage In Vitro Differentiation Protocol
| Stage | Duration | Key Media Components | Target Cell Population | Characterization Markers |
|---|---|---|---|---|
| S1: Definitive Endoderm | 3 days | Activin A (100 ng/mL), Wnt3a (50 ng/mL), low serum [66] | Definitive endoderm | SOX17+/FOXA2+ (>80%) [66] |
| S2: Primitive Gut Tube | 3 days | FGF10 (50 ng/mL), KAAD-cyclopamine (0.25 μM) [67] | Primitive gut tube | PDX1+ emerging |
| S3: Posterior Foregut | 3 days | FGF10 (50 ng/mL), KAAD-cyclopamine (0.25 μM), retinoic acid (2 μM) [67] | Posterior foregut | PDX1+/NKX6-1+ |
| S4: Pancreatic Progenitors | 3 days | FGF10 (50 ng/mL), KAAD-cyclopamine (0.25 μM), retinoic acid (2 μM), N2, B27 [67] | Pancreatic progenitors | PDX1+/NKX6-1+ (>80%) |
| S5: Endocrine Progenitors | 3 days | N2, B27, ascorbic acid, gamma-secretase inhibitor [67] | Endocrine progenitors | NGN3+/NKX6-1+ |
| S6: Hormone-Expressing Endocrine Cells | 7 days | N2, B27, ascorbic acid, T3 (1 μM), ALK5i (10 μM) [66] | Immature endocrine cells | INS+/GCG+ |
| S7: Final Maturation | 6 weeks | T3 (1 μM), N-acetyl cysteine (NAC, 1 mM), ZM447439 (1 μM) [67] | Maturing SC-islets | Monohormonal INS+ |
Critical Protocol Notes:
- 3D Aggregation: At S4 transition to suspension culture using AggreWell400 plates (750 cells/microwell) for uniform cluster formation [49] [67]
- Maturation Additives: ZM447439 (aurora kinase inhibitor) reduces proliferation and decreases enterochromaffin-like cells to ≈6.5% [67]
- Metabolic Maturation: The extended 6-week S7 stage is essential for developing appropriate glucose sensitivity [67]
In Vivo Maturation Assessment Protocol
The following methodology assesses functional maturation of SC-islets post-engraftment [49] [67].
Transplantation Procedure:
- Cell Preparation: Harvest S7w6 SC-islets and resuspend in transplantation medium (e.g., CMRL with 10% FBS) [49]
- Animal Model: Use 8-12 week old NOD-SCID mice rendered diabetic with streptozotocin (STZ, 180 mg/kg) [49]
- Engraftment: Transplant 5-10 million cells beneath the kidney capsule in 50-100 μL volume [49]
- Immunosuppression: Administer tacrolimus (1 mg/kg/day) and sirolimus (0.5 mg/kg/day) for allogeneic transplants [68]
Functional Assessment Timeline:
- Week 2-4: Monitor blood glucose for normalization (target: <200 mg/dL) [49]
- Month 2-3: Intraperitoneal glucose tolerance tests (IPGTT, 2 g/kg glucose) [49]
- Month 3-6: In situ kidney perfusion assays with sequential stimulation:
- Basal (2.8 mM glucose)
- High glucose (16.7 mM glucose)
- High glucose + 3-isobutyl-1-methylxanthine (IBMX, 100 μM)
- High K+ depolarization (30 mM KCl) [49]
Endpoint Analysis:
- Graft Retrieval: Remove kidney with engrafted islets at 6 months [67]
- Histology: Process for immunohistochemistry (INS, GCG, SST, NKX6-1, MAFA) [67]
- Electron Microscopy: Assess insulin granule ultrastructure [67]
- Single-Cell RNA Sequencing: Compare transcriptional profiles to primary human islets [67]
Signaling Pathways and Molecular Regulation
The maturation process involves coordinated activation of multiple signaling pathways that drive functional maturation.
Figure 1: Signaling pathways driving in vitro and in vivo maturation of SC-islets. In vitro maturation depends on targeted pathway modulation, while in vivo maturation leverages physiological cues from the host environment.
The Scientist's Toolkit: Essential Research Reagents
Table 3: Essential Research Reagents for SC-Islet Maturation Studies
| Reagent Category | Specific Examples | Function | Application Notes |
|---|---|---|---|
| Pluripotency Maintenance | mTeSR Plus, StemFlex, Recombinant Laminin-521 [49] | Maintain hiPSCs in undifferentiated state | Quality control of starting material is critical [49] |
| Differentiation Factors | Activin A, FGF10, KAAD-cyclopamine, Retinoic acid [67] [66] | Direct lineage specification through developmental stages | Concentration and timing are protocol-dependent [66] |
| Maturation Enhancers | T3 (triiodothyronine), N-acetyl cysteine (NAC), ZM447439 [67] | Promote functional maturation; reduce proliferation | Essential for acquiring glucose responsiveness in vitro [67] |
| 3D Culture Systems | AggreWell400 plates, Matrigel, Ultra-low attachment plates [49] [67] | Enable proper cell-cell contacts and polarization | Microwell systems produce more uniform aggregates [49] |
| Functional Assays | Glucose-stimulated insulin secretion (GSIS), Ca²⁺ imaging, Patch clamping [49] [67] | Assess functional maturity | Combine multiple assays for comprehensive evaluation [67] |
| Characterization Antibodies | Anti-INS, anti-GCG, anti-SST, anti-PDX1, anti-NKX6-1, anti-MAFA [67] | Validate identity and maturity status | MAFA expression correlates with functional maturity [67] |
The journey from functionally immature hiPSC-derived pancreatic progenitors to mature, glucose-responsive beta cells involves distinct yet complementary phases of in vitro and in vivo maturation. While extended in vitro culture with specific maturation factors can yield SC-islets with remarkable functional capacity, full physiological maturity is ultimately achieved only after in vivo engraftment, where the host microenvironment provides essential cues not yet fully replicable in laboratory conditions [67].
These protocols and analyses provide a framework for researchers to systematically address the challenge of functional immaturity in iPSC-derived beta cells. As the field advances, further elucidation of the critical maturation signals in both environments will accelerate the development of functionally complete stem cell-derived islets for diabetes research and therapy.
Overcoming Heterogeneity and Off-Target Cell Populations
The differentiation of induced pluripotent stem cells (iPSCs) into functional, glucose-responsive pancreatic beta cells represents a transformative approach for diabetes treatment and disease modeling [3] [1]. However, the persistent generation of heterogeneous and off-target cell populations remains a significant bottleneck, compromising the functional purity, safety, and therapeutic efficacy of the final cell product [69] [28]. This heterogeneity stems from the inherent complexity of pancreatic developmental pathways and the technical challenges in precisely recapitulating these processes in vitro [1].
Producing a homogeneous population of insulin-producing beta-like cells is crucial for reliable drug screening, accurate disease modeling, and successful cell replacement therapies [64]. Off-target populations, such as polyhormonal cells, exocrine cells, or other endocrine cell types (e.g., alpha or delta cells), not only reduce the yield of desired beta cells but also pose risks of aberrant function and potential tumorigenicity [69]. This application note details targeted strategies and refined protocols designed to enhance differentiation fidelity, minimize cellular heterogeneity, and ensure the generation of therapeutically viable iPSC-derived beta cells.
Key Molecular Pathways and Control Points
Directing iPSCs toward a definitive pancreatic beta cell fate requires precise manipulation of key developmental signaling pathways at specific temporal windows. The following diagram illustrates the core pathways targeted in the protocols discussed herein to reduce heterogeneity and promote uniform beta cell differentiation.
The strategic activation of WNT, Activin/Nodal, FGF, and Retinoic Acid pathways drives cells sequentially through definitive endoderm, pancreatic progenitor, and endocrine progenitor stages [42]. Crucially, the inhibition of Sonic Hedgehog (SHH) signaling promotes pancreatic specification over intestinal fates, while inhibition of Notch signaling is essential for the transition from pancreatic progenitors to endocrine cells, forcing exit from the cell cycle and initiating endocrine differentiation [42]. Failure to adequately inhibit these pathways is a primary source of off-target cell types.
Experimental Protocols for Enhanced Purity
Forward Programming with Inducible Transcription Factors
A primary strategy to overcome heterogeneity is "forward programming," which uses forced expression of key transcription factors to bypass the variability of standard cytokine-based protocols [28].
Protocol: Inducible NPM (NGN3, PDX1, MAFA) Forward Programming [28]
- Objective: To rapidly and homogeneously differentiate hiPSCs into glucose-responsive, insulin-producing cells.
Materials:
- Cell Line: hiPSCs.
- Lentiviral Constructs:
- pLentiEF1a-rtTABsdR: Confers Blasticidin resistance and expresses the reverse tetracycline-controlled transactivator (rtTA).
- pLentiTRE-NPMHygR: Contains the TRE3G promoter driving the expression of a polycistronic transcript for NGN3, PDX1, and MAFA (separated by T2A and P2A self-cleaving peptides), and confers HygromycinB resistance.
- Culture Medium: mTeSR+ for hiPSC maintenance.
- Selection Antibiotics: Blasticidin S HCl (1.0 µg/mL) and HygromycinB (25.0 µg/mL).
- Inducer: Doxycycline.
Methodology:
- Lentiviral Production: Produce lentiviruses separately by transfecting HEK293T cells with the packaging plasmid mix and each lentiviral construct.
- Primary Transduction: Transduce hiPSCs with the pLentiEF1a-rtTABsdR lentivirus. Select successfully transduced cells with Blasticidin (1.0 µg/mL) for 5 days to generate the stable rtTA-hiPSC line.
- Secondary Transduction: Transduce the rtTA-hiPSCs with the pLentiTRE-NPMHygR lentivirus. Select double-positive cells with HygromycinB (25.0 µg/mL) for 6 days to generate the final rtTA-NPM hiPSC line.
- Pancreatic Induction: Culture rtTA-NPM hiPSCs in pancreatic progenitor induction medium supplemented with doxycycline to activate the expression of NGN3, PDX1, and MAFA.
- Maturation: Maintain cells in doxycycline-containing medium for up to 10 days, analyzing marker expression and function at intervals.
Key Advantages: This system bypasses several intermediate differentiation steps, reducing the time required to generate insulin-producing cells from over 30 days to approximately two weeks and minimizing the window for off-target differentiation [28]. The inducible system allows for temporal control, which is critical for mimicking natural beta cell development.
Small Molecule-Based Differentiation with Vitamin C and Retinoic Acid
An alternative approach enhances the efficiency of standard protocols using specific small molecules to guide cell fate and reduce oxidative stress.
Protocol: Enhanced Differentiation with Vitamin C and Retinoic Acid [42]
- Objective: To generate functional pancreatic β-like cells (PβLCs) with high purity and maturity through a staged, serum-free protocol.
- Workflow Overview: The following diagram outlines the multi-stage process, highlighting key growth factors and small molecules added at each step to direct differentiation.
Detailed Methodology:
- Maintenance: Culture iPSCs in mTeSR1 medium on appropriate matrices until 70-80% confluent.
- Stage 0: Definitive Endoderm (24 hours). Differentiate iPSCs using Activin A (100 ng/mL) and CHIR99021 (2 µM) in a basal medium. CHIR99021 activates WNT signaling to prime the cells for endodermal differentiation.
- Stage 1: Definitive Endoderm Maturation (24 hours). Continue with Activin A (100 ng/mL), bFGF, and Ascorbic Acid (Vitamin C), but remove CHIR99021. Ascorbic acid acts as an epigenetic modulator, reducing oxidative stress and improving cell viability.
- Stage 2: Pancreatic Progenitor (Multiple days). Use bFGF, Ascorbic Acid, FGF10, NOGGIN, and SANT-1. SANT-1 is a critical inhibitor of Sonic Hedgehog (SHH) signaling, steering cells toward a pancreatic and away from an intestinal fate.
- Stage 3: Pancreatic β-like Cells (Multiple days). Differentiate with FGF10, SANT-1, Retinoic Acid, and high-dose Ascorbic Acid. Retinoic Acid is pivotal for patterning the pancreatic epithelium and promoting endocrine differentiation. The combination at this stage helps suppress alternative lineages and reinforces beta cell identity.
Key Advantages: This protocol is conducted under serum-free/xeno-free conditions, eliminating unpredictable variables from serum batches [42]. The use of SHH inhibitors like SANT-1 and pro-endocrine factors like Retinoic Acid directly counters the formation of major off-target populations.
Quantitative Outcomes and Functional Validation
The success of these protocols in reducing heterogeneity is measured by the expression of stage-specific markers and functional assays. The table below summarizes typical outcomes from the described protocols.
Table 1: Characterization of iPSC-Derived Beta Cells from Purification Protocols
| Protocol | Key Markers Analyzed | Reported Functional Outcomes | Evidence of Reduced Heterogeneity |
|---|---|---|---|
| Inducible NPM Forward Programming [28] | NGN3, PDX1, MAFA, NKX6.1, Insulin | Glucose-stimulated insulin secretion in monolayer culture; Limited sequential GSIS in spheroids. | Rapid onset of target genes (5 days); Population expressed key beta cell transcription factors. |
| Vitamin C/Retinoic Acid Protocol [42] | SOX17, FOXA2, PDX1, NKX6.1, NGN3, MAFA, Insulin | Expression of mature beta cell genes; Insulin secretion in response to glucose. | qPCR showed insulin expression without somatostatin (SST) or glucagon (GCG) detection, indicating pure endocrine population. |
Functional validation through Glucose-Stimulated Insulin Secretion (GSIS) is the gold standard. Cells are sequentially exposed to low (2.8 mM) and high (20 mM) glucose concentrations, and the amount of insulin secreted into the supernatant is measured via ELISA. A functionally mature and homogeneous population will show a significant increase in insulin secretion in response to high glucose [28].
The Scientist's Toolkit: Essential Reagents
The following table catalogues critical reagents for implementing these heterogeneity-reduction protocols.
Table 2: Key Research Reagent Solutions for iPSC to Beta Cell Differentiation
| Reagent Category | Specific Examples | Function in Protocol |
|---|---|---|
| Transcription Factors | NGN3, PDX1, MAFA | Master regulators for forward programming; drive pancreatic specification and beta cell maturation. |
| Growth Factors | Activin A, FGF10, bFGF, NOGGIN | Activin A induces definitive endoderm; FGFs and NOGGIN support pancreatic progenitor growth and patterning. |
| Small Molecule Inhibitors | SANT-1 (Hedgehog inhibitor), CHIR99021 (WNT activator) | SANT-1 inhibits off-target intestinal fate; CHIR99021 initiates endodermal commitment. |
| Differentiation Cofactors | Ascorbic Acid (Vitamin C), Retinoic Acid | Vitamin C reduces oxidative stress and aids maturation; Retinoic Acid promotes pancreatic and endocrine fate. |
| Selection Agents | Blasticidin S HCl, Hygromycin B | Select for successfully transduced cells in lentiviral-based forward programming protocols. |
Overcoming heterogeneity in iPSC-derived beta cell differentiation is not merely an academic exercise but a critical step toward clinical application. The protocols detailed here—employing forward programming with transcription factors or optimized small-molecule cocktails—provide robust, reproducible frameworks for generating highly enriched populations of functional beta-like cells. By meticulously controlling the temporal activation and inhibition of key developmental pathways, researchers can significantly reduce off-target populations, leading to more predictive disease models, more reliable drug screening platforms, and safer, more effective cell therapies for diabetes.
Improving Differentiation Efficiency and Scalability for Clinical Translation
The differentiation of human induced pluripotent stem cells (hiPSCs) into functional insulin-producing beta-like cells represents a transformative approach for diabetes treatment, offering a potential solution to the critical shortage of donor pancreatic islets [68] [1]. Diabetes mellitus remains a global health challenge affecting hundreds of millions, with Type 1 Diabetes (T1D) characterized by autoimmune destruction of pancreatic beta cells and Type 2 Diabetes (T2D) involving beta cell dysfunction and insulin resistance [68]. While current management strategies include insulin therapy and pancreatic islet transplantation, these approaches face limitations including lifelong dependency, hypoglycemia risk, donor scarcity, and immune rejection [68] [1].
hiPSC-derived beta cells offer distinct advantages for regenerative medicine, including patient-specificity, ethical acceptability, and potential for immune matching [70] [71]. However, translating these therapies to clinical practice requires overcoming significant challenges in differentiation efficiency, functional maturation, scalability, and safety [70]. This application note examines recent advances in protocol optimization, quality control, and manufacturing approaches to enhance the clinical translation of hiPSC-derived beta cell therapies.
Key Challenges in Beta Cell Differentiation
Differentiating hiPSCs into fully functional, glucose-responsive beta cells involves navigating several technical and biological hurdles that impact final therapeutic efficacy.
Efficiency and Purity
Current differentiation protocols often yield heterogeneous cell populations containing various pancreatic progenitor types rather than pure beta cell cultures [1]. This heterogeneity can compromise therapeutic outcomes and increase tumorigenic risk if undifferentiated pluripotent cells remain in the final product.
Functional Maturation
Many hiPSC-derived insulin-producing cells are considered "beta-like" rather than fully mature beta cells, as they may lack key characteristics of native beta cells including appropriate insulin content, regulated secretion dynamics, and precise glucose-responsive insulin release [68]. Achieving complete functional maturation remains a significant challenge.
Genomic and Epigenetic Stability
Reprogramming somatic cells to pluripotency and subsequent differentiation can introduce genetic and epigenetic abnormalities that raise safety concerns for clinical applications [70] [71]. These include integration-related mutagenesis from viral vectors and epigenetic memory effects that may bias differentiation outcomes.
Scalability and Manufacturing
Reliable scale-up under Good Manufacturing Practice (GMP) conditions presents substantial technical hurdles for consistent, cost-effective production of clinical-grade beta cells [70]. Critical questions around long-term engraftment, tissue integration, and immune tolerance also remain unresolved.
Optimization Strategies for Enhanced Differentiation
Signaling Pathway Modulation
Precise temporal control of key developmental signaling pathways is essential for directing pancreatic differentiation. The following diagram illustrates the core signaling pathway involved in efficient beta cell differentiation:
Table 1: Key Signaling Molecules and Their Roles in Beta Cell Differentiation
| Differentiation Stage | Key Signaling Molecules | Function | Optimal Concentration Range |
|---|---|---|---|
| Definitive Endoderm | Activin A, WNT3A | Induces endodermal commitment | 50-100 ng/mL [1] |
| Foregut Endoderm | FGF10, Retinoic Acid | Patterns primitive gut tube | 50 ng/mL FGF10, 2 μM RA [1] |
| Pancreatic Progenitor | NOGGIN, Retinoic Acid | Suppresses hepatic fate, promotes pancreatic commitment | 50 ng/mL NOGGIN, 0.5 μM RA [1] |
| Endocrine Progenitor | TGF-β inhibitors, EGF, BMP inhibitors | Induces endocrine differentiation | 10 μM ALK5i, 50 ng/mL EGF [1] |
| Beta Cell Maturation | T3, cAMP inducers | Promotes functional maturation | 1 μM T3, 10 μM Forskolin [1] |
Transcription Factor Expression
Precise regulation of key transcription factors is critical for proper pancreatic development. The following workflow illustrates the progressive activation of transcription factors during differentiation:
Table 2: Essential Transcription Factors and Their Roles in Pancreatic Development
| Transcription Factor | Expression Stage | Function | Clinical Significance |
|---|---|---|---|
| PDX1 | Pancreatic Progenitor | Master regulator of pancreatic development | Earliest specific marker of pancreatic commitment [1] |
| NKX6.1 | Pancreatic Progenitor/Beta Cell | Beta cell specification and function | Co-expression with PDX1 marks functional beta cell precursors [1] |
| NEUROG3 | Endocrine Progenitor | Endocrine lineage determination | Transient expression during endocrine commitment [1] |
| MAFA | Mature Beta Cell | Regulates insulin gene expression and glucose sensing | Marker of terminal beta cell maturation [1] |
| NGN3 | Endocrine Progenitor | Initiates endocrine differentiation | Critical for islet cell development; peak expression marks endocrine commitment [1] |
Advanced Differentiation Systems
Three-Dimensional Culture
3D culture systems significantly enhance differentiation efficiency by better mimicking the native pancreatic microenvironment. Organoid and spheroid cultures promote cell-cell interactions, polarization, and improved maturation compared to 2D systems [12]. These 3D structures more accurately replicate the cytoarchitecture of native islets, supporting enhanced endocrine function.
Co-culture Systems
Co-culture with supporting cell types such as endothelial cells, mesenchymal stem cells, or other pancreatic lineage cells (alpha and delta cells) creates a more physiological microenvironment that promotes beta cell maturation and function through paracrine signaling [1]. These interactions better simulate the cellular crosstalk occurring in native pancreatic islets.
Bioreactor Platforms
Scalable suspension bioreactors enable large-scale production of beta cells under controlled conditions, addressing a critical bottleneck in clinical translation. These systems improve oxygenation, nutrient distribution, and waste removal while allowing continuous monitoring and control of differentiation parameters [70].
Quality Control and Characterization
Rigorous quality assessment is essential for ensuring the safety and efficacy of hiPSC-derived beta cells. The following parameters should be evaluated throughout the differentiation process:
Phenotypic Characterization
- Flow cytometry: Quantify percentages of PDX1+/NKX6.1+ pancreatic progenitors and C-peptide+ beta cells
- Immunofluorescence: Assess co-localization of key markers and cellular architecture
- RNA sequencing: Evaluate global gene expression patterns and stage-specific marker expression
Functional Assessment
- Glucose-Stimulated Insulin Secretion (GSIS): Measure insulin release in response to varying glucose concentrations (2.8 mM vs. 20 mM)
- Calcium imaging: Monitor intracellular calcium fluxes in response to glucose stimulation
- Electrophysiology: Assess potassium ATP channel function and action potential activity
Safety Profiling
- Karyotyping and genomic analysis: Detect chromosomal abnormalities and genetic instability
- Teratoma formation assay: Test for residual pluripotent cells in animal models
- Tumorigenicity assessment: Evaluate potential for uncontrolled growth in vivo
Clinical Translation and Manufacturing
Current Clinical Landscape
Several clinical trials are evaluating stem cell-derived pancreatic cells for diabetes treatment, with promising early results:
Table 3: Clinical Trials of Stem Cell-Derived Pancreatic Cells
| Trial/Study | Cell Type | Key Findings | Reference |
|---|---|---|---|
| PEC-01 Cells (Phase 1/2) | Pancreatic endoderm cells (PEC-01) | Meal-responsive C-peptide secretion by Week 26; 20% insulin requirement reduction | [68] |
| CiPSC-islets (Case Study) | Autologous chemically induced iPSC-derived islets | Insulin independence achieved on Day 75; sustained glycemic control (HbA1c ≤5.7%) | [68] |
| Adipose-derived ASC + Vitamin D | Allogeneic adipose-derived stromal cells | Improved basal C-peptide levels; decreased HbA1c; 100% of treated patients in honeymoon phase at 6 months | [68] |
GMP Manufacturing Considerations
Successful clinical translation requires robust, reproducible manufacturing processes that comply with Good Manufacturing Practice (GMP) standards:
- Starting material quality: Comprehensive characterization of master cell banks
- Process consistency: Defined, validated differentiation protocols with minimal batch-to-batch variation
- Quality control systems: In-process testing and release criteria for final products
- Cryopreservation and storage: Reliable methods for product preservation and distribution
The Scientist's Toolkit: Essential Research Reagents
Table 4: Key Research Reagents for Beta Cell Differentiation
| Reagent Category | Specific Examples | Function | Application Notes |
|---|---|---|---|
| Growth Factors | Activin A, FGF10, EGF | Direct lineage specification and proliferation | Use GMP-grade for clinical applications; optimize concentration for each cell line [1] |
| Small Molecules | ALK5i, CHIR99021, Retinoic Acid | Modulate signaling pathways | Enables precise temporal control; enhances differentiation efficiency [1] |
| Basal Media | DMEM/F12, RPMI-1640 | Provide nutritional support | Supplement with appropriate factors at each differentiation stage [1] |
| Matrix Proteins | Matrigel, Laminin-521, Vitronectin | Provide structural support and signaling cues | Influences cell polarity and function; xeno-free options preferred for clinical use [70] |
| Gene Editing Tools | CRISPR/Cas9, TALENs | Genetic modification and correction | Enables disease modeling and correction of pathogenic mutations [70] [71] |
Improving the differentiation efficiency and scalability of hiPSC-derived beta cells requires a multifaceted approach addressing signaling pathway optimization, transcriptional regulation, culture systems, and rigorous quality control. Recent advances in protocol refinement, 3D culture, and manufacturing technologies are accelerating the clinical translation of these promising therapies. While challenges remain in achieving complete functional maturation and ensuring long-term safety, the continued refinement of differentiation strategies coupled with robust manufacturing processes holds significant promise for transforming diabetes treatment through regenerative medicine approaches.
Strategies for Ensuring Genetic Stability and Minimizing Tumorigenic Risk
The differentiation of induced pluripotent stem cells (iPSCs) into insulin-producing beta cells represents a transformative approach for diabetes treatment and disease modeling [3] [1]. However, the clinical application of iPSC-derived therapies faces significant challenges, primarily concerning genetic stability and tumorigenic risk [72]. These risks emerge from multiple sources, including the reprogramming process itself, the propensity of pluripotent cells for genomic instability during culture, and the potential for residual undifferentiated cells to form teratomas after transplantation [73] [72]. This application note outlines evidence-based strategies and detailed protocols to mitigate these risks, ensuring the safe development of iPSC-derived beta cells for diabetes research and therapy.
Genetic Instability in Culture
iPSCs are susceptible to acquiring genetic abnormalities during extended in vitro culture. These changes often confer selective growth advantages, allowing affected cells to overtake a culture within a few expansion cycles [73]. The presence of such genetically altered cells in therapeutic products poses a significant risk, as they could lead to uncontrolled proliferation post-transplantation.
Tumorigenicity from Reprogramming Factors
The reprogramming process often employs transcription factors such as OCT4, SOX2, KLF4, and c-MYC (OSKM) [72]. Notably, c-MYC is a recognized oncogene constitutively expressed in over 70% of human cancers, while OCT4 and SOX2 are highly expressed in various cancers, including advanced-stage ovarian cancer [72]. The use of integrating viral vectors for factor delivery further exacerbates this risk through potential insertional mutagenesis and persistent transgene expression that can impede proper differentiation [72].
Table 1: Key Transcription Factors in Reprogramming and Associated Oncogenic Risks
| Factor | Primary Function | Oncogenic Association | Risk Mitigation Approach |
|---|---|---|---|
| c-MYC | Regulates cell proliferation and metabolism | Constitutively expressed in >70% of human cancers [72] | Use in non-integrating systems; optional for reprogramming |
| OCT4 | Maintains pluripotency | Highly expressed in advanced-stage ovarian cancer [72] | Transient expression; non-integrating delivery |
| SOX2 | Pluripotency regulation | Expressed in prostate, breast, lung, colon, and ovarian cancers [72] | Precise expression control; removal after reprogramming |
| KLF4 | Pluripotency factor | Oncogenic in osteosarcoma cells [72] | Non-integrating delivery systems |
Strategic Framework for Risk Mitigation
A comprehensive approach to minimizing tumorigenic risk spans the entire workflow, from donor cell selection to final product administration. The strategic framework comprises four interconnected pillars:
Protocols and Methodologies
Donor Selection and Starting Material Validation
Objective: Establish genetically stable iPSC lines with minimal pre-existing mutations.
Protocol:
- Donor Selection Criteria: Prefer donors younger than 35 years to minimize accumulated mutations. Select source tissues less exposed to UV radiation; skin fibroblasts from sun-protected areas or mesenchymal stem cells from internal locations are favorable [73].
- Comprehensive Donor Cell Screening: Perform Next-Generation Sequencing (NGS)-based screening of donor cells to establish baseline genomic integrity. Focus on cancer-associated genes, particularly TP53, which shows higher mutation propensity in UV-exposed fibroblasts [73].
- Banking of Starting Material: Create an extensively characterized Master Cell Bank of donor cells before reprogramming.
Non-Integrating Reprogramming Methods
Objective: Generate iPSCs without genomic integration of reprogramming factors.
Protocol:
- Vector Selection: Employ non-integrating viral vectors (Sendai virus, adenovirus) or non-viral methods (episomal vectors, RNA, proteins, chemicals) [72].
- Sendai Virus Protocol:
- Transduce donor cells with CytoTune Sendai Viral Particles containing OCT4, SOX2, KLF4, and c-MYC (optional).
- Culture transduced cells under standard iPSC conditions for 14-21 days until colonies emerge.
- Confirm loss of Sendai virus by RT-PCR after 5-10 passages to ensure non-integration [6].
- Chemical Reprogramming: Use small molecule cocktails to induce pluripotency, achieving reprogramming efficiencies of approximately 0.001% while eliminating genetic modification concerns [72].
Table 2: Comparison of Reprogramming Methods for Clinical Application
| Method | Integration Risk | Reprogramming Efficiency | Tumorigenic Risk | Clinical Applicability |
|---|---|---|---|---|
| Retroviral/Lentiviral | High (random integration) | High | High (persistent transgene expression) [72] | Low |
| Sendai Virus | None (cytoplasmic replication) | Moderate | Low (cleared from culture) [6] | High |
| Episomal Vectors | Low (episomal loss) | Low | Low (transient expression) [72] | High |
| Chemical Reprogramming | None | Very Low (~0.001%) [72] | Very Low | Promising for future |
Genetic Stability Monitoring During Culture
Objective: Maintain genomic integrity throughout iPSC expansion and differentiation.
Protocol:
- Culture Condition Optimization: Implement robust expansion protocols that minimize cell stress. Use ROCK inhibitors to reduce selective pressure during passaging [73]. Supplement culture medium with nucleosides to meet high DNA synthesis demands of rapidly-dividing cells, potentially mitigating DNA alterations [73].
- Stage-Appropriate Genetic Checkpoints: Integrate mandatory genetic integrity assessments at critical process points:
- Master iPSC Bank Characterization: Perform karyotyping, copy number variation (CNV) analysis, and whole genome sequencing.
- Pre-Differentiation Checkpoint: Assess CNVs and screen for mutations in genes associated with selective advantage (e.g., BCL2L1) [73].
- Post-Differentiation Verification: Conduct targeted genetic analysis on differentiated beta cells.
- Usage Testing Protocol: Thaw banked cells and culture for 4 passages, then re-test genetic integrity to confirm stability at later passage points [73].
Purification and Safety Switches
Objective: Eliminate residual undifferentiated cells and provide contingency controls.
Protocol:
- Cell Sorting for Pluripotency Marker-Negative Populations: Differentiate iPSCs toward beta cell lineage using established protocols [6] [1]. Harvest cells and sort for TRA-1-60-negative or SSEA4-negative populations to remove residual pluripotent cells before transplantation.
- Implementation of FailSafe Technology:
- Introduce an inducible suicide gene construct (e.g., herpes simplex virus thymidine kinase) under control of a pluripotency-specific promoter (e.g., OCT4) into iPSCs.
- Validate system functionality by treating a test population with pro-drug ganciclovir (10 µM for 24-48 hours) and confirming elimination of undifferentiated cells while preserving differentiated beta cells [73].
- Include this safety switch in the final product for potential clinical administration if concerns arise post-transplantation.
The Scientist's Toolkit: Essential Research Reagents
Table 3: Key Reagents for Genetic Stability Assessment and Risk Mitigation
| Reagent/Category | Specific Examples | Application | Function |
|---|---|---|---|
| Reprogramming Systems | CytoTune Sendai Virus, Episomal Vectors | iPSC Generation | Non-integrating delivery of reprogramming factors [72] [6] |
| Culture Supplements | ROCK Inhibitor (Y-27632), Nucleoside Mix | Cell Culture | Enhance cell survival after passaging; support genomic stability [73] |
| Genetic Screening Tools | Karyotyping, CNV Analysis, NGS Panels | Quality Control | Detect chromosomal abnormalities and copy number variations [73] |
| Cell Sorting Reagents | Anti-TRA-1-60, Anti-SSEA4 Antibodies | Purification | Remove residual pluripotent cells from differentiated populations |
| Safety Switch Systems | FailSafe/iC9 Inducible Systems | Risk Mitigation | Contingency mechanism to eliminate proliferating cells if needed [73] |
| Differentiation Matrices | Matrigel, Laminin-521, Synthetic PEG Hydrogels | Beta Cell Differentiation | Provide appropriate 3D environment for functional maturation [6] |
Integrated Workflow for Safe Beta Cell Generation
The complete workflow from donor cell to transplantable beta cells incorporates multiple safety checkpoints and risk mitigation strategies at critical stages:
Ensuring genetic stability and minimizing tumorigenic risk in iPSC-derived beta cells requires a systematic, multi-layered approach spanning the entire development pipeline. By implementing rigorous donor screening, non-integrating reprogramming methods, comprehensive genetic monitoring throughout culture and differentiation, and final safety mechanisms including purification and inducible suicide systems, researchers can significantly enhance the safety profile of iPSC-based therapies for diabetes. These protocols provide a foundation for developing clinically viable beta cell replacement therapies that fulfill the promise of regenerative medicine for diabetes treatment while prioritizing patient safety. As the field advances, continued refinement of these strategies will be essential for translating iPSC technology from research laboratories to clinical applications.
The differentiation of induced pluripotent stem cells (iPSCs) into functional, insulin-producing β-cells represents a promising avenue for the treatment of type 1 diabetes and for advanced drug screening applications [74] [75]. A critical factor in this process is the successful formation of three-dimensional (3D) cellular aggregates that closely mimic the native pancreatic islet environment [76] [77]. These 3D structures enhance cell-cell and cell-extracellular matrix (ECM) interactions, which are essential for achieving proper cell differentiation, function, and longevity [78] [77]. This document provides detailed application notes and protocols for optimizing the formation and function of iPSC-derived insulin-producing cells using advanced scaffold and bioreactor technologies.
The Role of Scaffolds and the Extracellular Matrix in β-cell Maturation
The extracellular matrix provides critical biochemical and mechanical cues that guide cell behavior, survival, and function. For pancreatic β-cells, specific ECM components are essential for maintaining viability and promoting insulin secretion [79] [80].
Table 1: Essential Extracellular Matrix Components for Pancreatic Islet Function
| ECM Component | Properties | Role in Pancreatic Islets | References |
|---|---|---|---|
| Collagen IV & VI | Abundant in vascular basement membrane | Promotes sustainability of primary islets and β-cell lines | [79] [80] |
| Laminins | Heterodimer glycoproteins with three polypeptide chains | Critical for β-cell expansion and glucose-stimulated insulin release in humans | [79] [80] |
| Fibronectins | High molecular weight glycoproteins | Improves viability and expansion of rat islets; reduces apoptosis in β-cell lines | [79] [80] |
| Glycosaminoglycans (GAGs) | Linear disaccharides (e.g., Hyaluronic acid, Heparan Sulfate) | Associated with β-cell function; involved in vascular basement membrane and amyloid formation | [80] |
Application of Decellularized ECM (dECM)
Decellularized pancreatic ECM (dECM) preserves the native microarchitecture and biochemical signals of the natural pancreatic environment, making it a superior substrate compared to synthetic matrices [79]. The decellularization process removes cellular material while retaining the structural and functional ECM components.
Protocol 2.1: Preparation and Use of Pancreatic dECM Hydrogels
Materials:
- Porcine or human pancreatic tissue
- Detergents (e.g., SDS, Triton X-100) or detergent-free solutions (e.g., ultrapure water with DNase)
- Sterile phosphate-buffered saline (PBS)
- Lyophilizer
- Pepsin solution
- Neutralization buffer
Method:
- Tissue Decellularization:
- Rinse pancreatic tissue thoroughly with PBS to remove blood residues.
- For detergent-based method: Perfuse or immerse tissue in 1% SDS solution for 24-48 hours with continuous agitation.
- For gentle, detergent-free method: Use repeated freeze-thaw cycles followed by incubation in ultrapure water and DNase treatment.
- Wash thoroughly with PBS until all detergent is removed (verified by absence of foam).
ECM Digestion and Hydrogel Formation:
- Mince the acellular dECM into small pieces and lyophilize.
- Digest the lyophilized dECM using 1 mg/mL pepsin in 0.1 M HCl for 48 hours under constant stirring at room temperature.
- Neutralize the pre-gel solution using 0.1 M NaOH and appropriate buffer (e.g., 10× PBS) to physiological pH and salt concentration.
- Keep the solution on ice until use to prevent premature gelling.
3D Culture with iPSC-Derived Pancreatic Progenitors:
- Resuspend the cell pellet in the neutralized dECM pre-gel solution at a density of 10-50 × 10^6 cells/mL.
- Plate the cell-hydrogel mixture in culture plates and incubate at 37°C for 30-60 minutes to form a gel.
- Culture with appropriate differentiation media, changing media every 2-3 days.
Bioreactor Systems for 3D Aggregate Cultivation
Bioreactors provide a controlled environment for 3D culture, enabling efficient mass transport, mechanical stimulation, and scalable production of cellular aggregates [76] [78] [81]. These systems are crucial for moving beyond the limitations of static 2D culture.
Table 2: Comparison of Bioreactor Systems for 3D β-cell Aggregates
| Bioreactor Type | Mechanism | Advantages | Limitations | Shear Stress |
|---|---|---|---|---|
| Stirred-Tank | Magnetic impeller for suspension | Homogeneous culture environment; scalable | Potential for high shear damage | Variable, can be high |
| Perfusion | Continuous medium flow through fixed bed | Enhanced nutrient/waste exchange; controlled shear | Scaffold required; potential for channeling | 1-15 mPa [81] |
| Rotating Wall | Constructs suspended in slow rotation | Low shear stress;模拟微重力 | Low throughput; limited scalability | Very low |
| Micro-Bioreactors | Miniaturized chambers with microfluidics | High-throughput screening; low reagent use | Small scale; not for production | Precisely controllable |
Protocol 3.1: Culturing iPSC-Derived β-cell Aggregates in a Perfusion Bioreactor
Materials:
- Custom-designed or commercial perfusion bioreactor system
- Peristaltic or syringe pumps
- Gas exchange module (oxygenator)
- Bubble trap
- Sterile tubing set
- iPSC-derived pancreatic progenitors
- Porous 3D scaffold (e.g., PLGA, alginate)
Method:
- System Setup and Sterilization:
- Assemble the bioreactor system, ensuring all components (bioreactor chamber, medium reservoir, bubble trap, oxygenator) are securely connected.
- Sterilize the system using autoclaving or gamma irradiation, or use sterile single-use components.
- Perfuse the system with 70% ethanol for 24 hours, followed by sterile PBS for another 24 hours to remove ethanol residues.
Scaffold Seeding and Loading:
- Seed iPSC-derived pancreatic progenitors onto porous scaffolds at a density of 10-20 × 10^6 cells/cm³ scaffold volume.
- Allow cells to attach under static conditions for 4-6 hours in the bioreactor chamber.
- Carefully connect the chamber to the perfusion circuit.
Perfusion Culture:
- Initiate perfusion at a low flow rate (0.1-0.5 mL/min) to allow initial cell adaptation.
- Gradually increase flow rate over 48 hours to the final operating rate (typically 1-5 mL/min, generating 1-15 mPa shear stress).
- Maintain culture at 37°C, 5% CO₂, with continuous oxygen monitoring and adjustment.
- Monitor and record glucose consumption and lactate production daily to assess metabolic activity.
- Culture for 14-30 days, sampling periodically for functional assessment.
The Scientist's Toolkit: Essential Research Reagent Solutions
Table 3: Key Research Reagent Solutions for 3D β-cell Aggregate Formation
| Reagent/Category | Specific Examples | Function/Application | Notes |
|---|---|---|---|
| Reprogramming Factors | Yamanaka factors (OSKM: Oct4, Sox2, Klf4, c-Myc) | Somatic cell reprogramming to iPSCs | Non-integrating methods (e.g., Sendai virus, mRNA) preferred for safety [74] |
| Bioinks | Alginate, Gelatin methacryloyl (GelMA), Nanofibrillated cellulose, dECM hydrogels | 3D support structure for bioprinting and aggregate formation | Must be biocompatible, provide structural support, and allow nutrient diffusion [74] [80] |
| Small Molecules | Valproic acid (histone deacetylase inhibitor), BIX-01294 (histone methyltransferase inhibitor) | Enhance reprogramming efficiency; replace transcription factors | Enable footprint-free iPSC generation [74] |
| Pro-endocrine Transcription Factors | Pdx-1, Ngn3, Pax4, Arx | Direct differentiation of iPSCs toward pancreatic endocrine lineage | Ratio of Arx to Pax4 influences α-cell vs. β-cell lineage decision [80] |
| Supporting Cells | Human Mesenchymal Stem/Stromal Cells (hMSCs), Endothelial Cells, α-cells | Enhance vasculogenesis; provide paracrine support; improve graft survival | hMSCs secrete anti-inflammatory cytokines (e.g., TSG-6, STC-1) [76] |
Experimental Workflow and Signaling Pathways
The following diagram illustrates the complete experimental workflow from iPSC reprogramming to the formation and functional assessment of 3D β-cell aggregates, highlighting key signaling pathways and quality control checkpoints.
Experimental Workflow for 3D β-cell Aggregate Generation
Protocol for Functional Assessment of 3D β-cell Aggregates
Protocol 6.1: Glucose-Stimulated Insulin Secretion (GSIS) and Ultrastructural Analysis
Materials:
- Krebs-Ringer Bicarbonate HEPES buffer (KRBH)
- Low glucose (2.8 mM) and high glucose (20 mM) KRBH solutions
- ELISA kit for insulin detection
- TEM fixation buffer (2.5% glutaraldehyde in 0.1 M phosphate buffer)
- AggreWell plates or similar for spheroid formation
- Toluidine blue stain
GSIS Method:
- Sample Preparation:
- Transfer 10-20 uniform-sized aggregates to a 24-well plate.
- Wash twice with pre-warmed KRBH containing 2.8 mM glucose.
Static GSIS Assay:
- Pre-incubate aggregates in 500 µL of 2.8 mM glucose KRBH for 1 hour at 37°C.
- Replace with 500 µL fresh 2.8 mM glucose KRBH; incubate 1 hour (basal condition).
- Collect and save supernatant for basal insulin measurement.
- Replace with 500 µL 20 mM glucose KRBH; incubate 1 hour (stimulated condition).
- Collect supernatant for stimulated insulin measurement.
- Extract total insulin from aggregates using acid-ethanol extraction.
Analysis:
- Measure insulin concentrations in all samples using ELISA.
- Calculate stimulation index (SI) as: SI = (stimulated insulin) / (basal insulin).
- Functional islets typically exhibit SI >2 [77].
Ultrastructural Analysis Method:
- Fixation:
- Fix aggregates in 2.5% glutaraldehyde in 0.1 M phosphate buffer (pH 7.2) at 4°C for 12 hours.
Processing:
- Post-fix in 3% osmium tetroxide in Palade's buffer for 2 hours.
- Dehydrate through ascending ethanol series (30%-100%).
- Embed in Spurr's resin and polymerize at 60°C overnight.
Sectioning and Staining:
- Cut semi-thin (1 µM) sections and stain with 1% toluidine blue for light microscopy.
- Cut ultra-thin (100 nm) sections for TEM using an ultra-microtome.
- Examine sections under TEM for characteristic β-cell features: mature insulin granules with dense cores and clear halos [77].
The successful generation of functional, iPSC-derived insulin-producing cells requires careful attention to 3D aggregate formation using appropriate scaffolds and bioreactor systems. The protocols outlined herein provide a foundation for optimizing this process, with emphasis on the critical roles of the extracellular matrix, controlled physiological cues, and functional validation. As these technologies continue to evolve, they hold significant promise for advancing cellular therapies for diabetes and improving in vitro models for drug discovery.
Benchmarking and Functional Validation of iPSC-Derived Beta Cells
The generation of functional insulin-producing beta cells from induced pluripotent stem cells (iPSCs) represents a cornerstone of modern regenerative medicine approaches to diabetes. A critical challenge in this field has been the precise definition and accurate identification of a mature, functional beta cell state. While current differentiation protocols successfully generate insulin-expressing cells, the resulting populations often exhibit transcriptional and functional immaturity, failing to fully recapitulate the glucose-responsive characteristics of primary human islet beta cells [82]. Establishing a core beta cell identity through comprehensive transcriptional profiling and validated marker expression is therefore essential for improving differentiation efficiency, enabling the purification of target populations, and facilitating the development of robust cell-based therapies for diabetes.
This Application Note provides a structured framework for defining core beta cell identity by integrating current research on transcriptional markers, functional maturation criteria, and standardized assessment protocols. It is specifically designed to support researchers and drug development professionals in characterizing iPSC-derived beta-like cells (SC-β cells) with greater precision and reliability, thereby advancing both basic research and clinical applications in diabetes therapy.
Core Markers of Beta Cell Maturation and Identity
A mature beta cell identity is established through a specific combination of transcription factors, functional genes, and surface markers that distinguish it from progenitor states and other endocrine cell types. The following tables summarize key markers validated in primary human tissues and their expression in stem cell-derived islets (SC-islets).
Table 1: Key Transcription Factors Defining Beta Cell Identity and Maturation
| Gene | Full Name | Role in Beta Cell Development | Expression in SC-β Cells | Validation in Human Development |
|---|---|---|---|---|
| PDX1 | Pancreatic and Duodenal Homeobox 1 | Master regulator of pancreatic development; essential for beta cell function [1] | Present in progenitors and beta cells | Early and persistent expression [1] |
| NKX6.1 | NK6 Homeobox 1 | Critical for beta cell specification and functional maturation [83] | Present in beta-cell populations [83] | Co-expression with PDX1 marks pancreatic progenitors [1] |
| NGN3 | Neurogenin 3 | Transient expression in endocrine progenitors; necessary for all endocrine cell fate [84] | Transiently induced during differentiation | Short expression window in human development [84] |
| MAFA | V-maf Musculoaponeurotic Fibrosarcoma Oncogene Homolog A | Regulates insulin gene expression and glucose sensing [84] [82] | Low in vitro, increases after transplantation [82] | Increases postnatally during maturation [82] |
| NEUROD1 | Neurogenic Differentiation 1 | Essential for insulin gene transcription and islet cell development [85] | Present in endocrine cells | Expressed in fetal and adult beta cells [1] |
Table 2: Functional and Structural Genes Associated with Beta Cell Maturity
| Gene | Protein | Function in Beta Cells | Correlation with Maturation | Notes on SC-β Cell Expression |
|---|---|---|---|---|
| UCN3 | Urocortin 3 | Paracrine signal to delta cells; co-packaged with insulin [82] | Considered a maturation marker in mice but not in human fetal development [82] | Low in vitro, increases after in vivo transplantation [82] |
| G6PC2 | Glucose-6-Phosphatase Catalytic Subunit 2 | Modulates glucose-stimulated insulin secretion | Correlates with functional maturation in human development [82] | Validated as a reliable maturation marker [82] |
| SLC2A1 | GLUT1 Glucose Transporter | Glucose uptake | Higher in fetal beta cells; decreases with maturation [82] | Expression pattern can indicate immaturity |
| SLC2A2 | GLUT2 Glucose Transporter | High-capacity glucose transport | Characteristic of mature beta cells [86] | Often low in SC-β cells |
| IAPP | Islet Amyloid Polypeptide | Co-secreted with insulin | Increases along pseudotime in cultured SC-β cells [83] | Marker of progressing maturation in vitro |
| CHGB | Chromogranin B | Secretory granule protein | Correlates with functional maturation [82] | Reliable marker validated in human tissues |
The differentiation of iPSCs into beta cells follows a developmental path mimicking in vivo pancreatic organogenesis, progressing through definitive endoderm, primitive gut tube, pancreatic progenitors, endocrine progenitors, and finally hormone-expressing endocrine cells [1]. The accompanying diagram illustrates the key transcriptional regulators and signaling pathways active at each stage of this differentiation process, providing a visual roadmap for researchers to monitor progression toward a defined beta cell identity.
Experimental Protocols for Identity Assessment
Single-Cell RNA Sequencing for Transcriptomic Profiling
Purpose: To comprehensively characterize the cellular heterogeneity, identity, and maturation state of iPSC-derived beta cell populations at single-cell resolution.
Methodology:
- Cell Preparation: Dissociate SC-islet clusters into single-cell suspension using Accumax enzyme solution [6].
- Cell Viability Assessment: Confirm >85% viability using trypan blue exclusion.
- Library Preparation: Utilize high-depth Smart-seq2 protocol to sequence approximately 1 million reads per cell [85].
- Cell Capture and Barcoding: Use 10X Genomics Chromium system for high-throughput single-cell capture.
- Bioinformatic Analysis:
- Align sequences to human reference genome (GRCh38)
- Perform quality control filtering (minimum 500 genes/cell, mitochondrial content <20%)
- Normalize data using SCTransform
- Cluster cells using graph-based methods (Seurat)
- Identify marker genes for each cluster
- Project data against reference human islet datasets
Expected Outcomes: Identification of distinct cell populations including target SC-β cells, off-target cell types (α-like, enterochromaffin-like, ductal), and assessment of maturity through comparison with primary human islet reference data [83].
Immunofluorescence Validation of Protein Expression
Purpose: To confirm protein-level expression of key beta cell identity markers and assess cellular composition.
Methodology:
- Fixation: Fix cells or SC-islet clusters in 4% paraformaldehyde for 15-20 minutes [6] [82].
- Permeabilization and Blocking: Permeabilize with 0.5% Triton-X100, block with UltraV block or protein serum for 1 hour.
- Primary Antibody Incubation: Incubate with validated primary antibodies for 3 hours at room temperature or overnight at 4°C using appropriate dilutions [6].
- Antibody Panel Example:
- Guinea pig anti-insulin (1:500)
- Mouse anti-NKX6.1 (1:250)
- Rabbit anti-MAFA (1:200)
- Goat anti-PDX1 (1:300)
- Secondary Antibody Detection: Incubate with species-specific fluorescent secondary antibodies for 30-60 minutes at room temperature.
- Nuclear Staining: Counterstain with DAPI (1:5000).
- Imaging and Analysis: Acquire images using high-resolution confocal microscopy; quantify co-localization of markers.
Quality Control: Include appropriate positive controls (human adult pancreas sections) and negative controls (omission of primary antibodies).
Functional Assessment through Glucose-Stimulated Insulin Secretion (GSIS)
Purpose: To evaluate dynamic insulin secretion in response to glucose challenge, a hallmark of functional beta cell maturity.
Methodology:
- Sample Preparation: Hand-pick 50-100 size-matched SC-islet clusters, allow recovery overnight in low-glucose culture medium.
- Static GSIS Assay:
- Pre-incubate islets in 2.8 mM glucose KRB buffer for 1 hour
- Incubate in 2.8 mM glucose for 30 minutes (low glucose)
- Transfer to 20 mM glucose for 30 minutes (high glucose)
- Optional: Include 30 mM KCl as depolarization control
- Insulin Measurement: Collect supernatants and measure insulin content using ELISA or Luminex assay.
- Normalization: Lyse islets to determine total insulin/DNA content for secretion normalization.
- Calculation: Calculate stimulation index as (insulin at high glucose)/(insulin at low glucose).
Interpretation: Functional SC-β cells should exhibit a stimulation index >2, though primary human islets typically achieve indices of 3-5 [6]. Assess both the fold-change and absolute insulin secretion rates.
The Impact of Environmental Exposures on Beta Cell Identity
Emerging evidence indicates that environmental factors, particularly endocrine-disrupting chemicals (EDCs), can significantly alter the maturation and identity of developing beta cells. A recent study demonstrated that exposure to a mixture of bisphenol A, bisphenol S, and trans-nonachlor during SC-islet differentiation resulted in significant alterations to the proliferation-maturation balance [87].
Table 3: Effects of Environmental Exposures on Beta Cell Maturation
| Exposure | Experimental Model | Impact on Beta Cell Identity | Molecular Signatures |
|---|---|---|---|
| EDC Mixture (BPA, BPS, trans-nonachlor) | iPSC-derived SC-islets during differentiation [87] | Altered proliferation-maturation balance; delayed differentiation | Reduced beta-cell maturity markers; Increased proliferation markers (KI67) |
| Maternal Obesity / High-Fat Diet | Mouse model tracing progenitor lineages [86] | Reduced proportion of high-functioning beta cell subtypes | Altered expression of genes regulating insulin vesicle production and secretion |
The following diagram illustrates how environmental exposures disrupt the normal progression to a mature beta cell state, providing researchers with a framework for investigating environmental impacts on their differentiation outcomes.
The Scientist's Toolkit: Essential Research Reagents
Table 4: Key Reagents for Beta Cell Differentiation and Characterization
| Reagent/Category | Specific Examples | Function/Application | Protocol References |
|---|---|---|---|
| Differentiation Factors | Activin A, FGF, Retinoic Acid, LDN-193189, T3, GLP-1 analogs | Direct lineage specification through staged activation/inhibition of developmental pathways | [6] [1] |
| 3D Culture Systems | AggreWell plates, rotating suspension bioreactors | Promote proper cell polarization and islet-like organization | [6] |
| Extracellular Matrices | Matrigel, recombinant laminins | Provide structural support and biochemical cues for differentiation | [6] |
| Key Antibodies | Anti-PDX1, NKX6.1, INS, GCG, MAFA, UCN3, NGN3 | Characterization and quantification of differentiation efficiency | [6] [82] |
| Functional Assay Reagents | KRB buffer, glucose solutions, KCl, insulin ELISA kits | Assessment of glucose-stimulated insulin secretion | [6] [83] |
| Cell Sorting Markers | CD49a (ITGA1), Newport Green | Enrichment of specific pancreatic progenitor and beta cell populations | [88] [83] |
Defining a core beta cell identity requires multidimensional assessment integrating transcriptional, protein, functional, and structural metrics. No single marker is sufficient to confirm mature beta cell identity; rather, researchers should employ a combinatorial approach assessing multiple parameters across different regulatory levels.
The most reliable strategy involves correlating key transcription factor expression (PDX1, NKX6.1, MAFA) with functional maturity markers (G6PC2, IAPP) while verifying absence of off-target markers (TPH1 for enterochromaffin cells, GCG for alpha cells) [82] [83]. Crucially, transcriptional profiles must be validated against functional competence through rigorous GSIS testing. Furthermore, researchers should remain cognizant of how environmental factors including EDCs and metabolic conditions can alter beta cell identity and maturation trajectories.
By implementing the comprehensive profiling and validation frameworks outlined in this Application Note, researchers can more accurately define, assess, and improve the maturity and identity of iPSC-derived beta cells, accelerating progress toward effective cell-based therapies for diabetes.
The differentiation of induced pluripotent stem cells (iPSCs) into insulin-producing pancreatic β-cells represents a frontier in regenerative medicine for diabetes treatment [3] [1]. A critical challenge in this field is the generation of not just β-like cells, but fully functional and mature cells capable of responding to physiological glucose levels with appropriate insulin secretion [4]. The functional maturation of these stem cell-derived β-cells (SC-β cells) must be rigorously validated through specialized assays that assess their dynamic response to stimuli. Two cornerstone methods for evaluating β-cell functionality are the Glucose-Stimulated Insulin Secretion (GSIS) assay, which directly measures the insulin secretory capacity, and calcium flux imaging, which probes the early signaling events that trigger secretion [89] [90]. This application note provides detailed protocols and contextual data for these essential assays, framed within the context of iPSC-derived β-cell research.
The Critical Role of Functional Assays in iPSC-Derived β-Cell Research
The ultimate goal of differentiating iPSCs into β-cells is to provide a cell therapy for diabetes, a metabolic disorder affecting millions worldwide characterized by a deficiency or dysfunction of insulin-producing β-cells [1] [4]. Current differentiation protocols have achieved remarkable progress, yet the generated cells often exhibit functional immaturity compared to primary human islet β-cells [4]. This immaturity can manifest as inadequate insulin secretion, faulty glucose sensing, or unstable identity.
Functional assays like GSIS and calcium flux are therefore not merely quality checks; they are indispensable tools for:
- Guiding Protocol Optimization: Providing quantitative feedback on the success of differentiation protocols and enabling iterative improvements [4].
- Benchmarking Maturity: Establishing how closely SC-β cells mimic the function of primary human β-cells.
- Uncovering Mechanisms: Revealing defects in the glucose-stimulated secretion pathway, from membrane depolarization to calcium influx and insulin vesicle exocytosis.
- Validating Therapeutic Potential: Ensuring that cells destined for transplantation are functionally competent.
A key epigenetic factor recently identified as critical for successful differentiation is the histone demethylase KDM4A. Knockdown of KDM4A in iPSCs during differentiation led to a significant reduction in the expression of key β-cell transcription factors (PDX1, NKX6.1) and a dramatic ~80% decrease in glucose-stimulated insulin secretion [10]. This finding underscores that overcoming epigenetic barriers is essential for generating functional cells, and that GSIS is a sensitive readout of this functional maturity.
Glucose-Stimulated Insulin Secretion (GSIS) Assay
The GSIS assay evaluates the capacity of β-cells to secrete insulin in a biphasic manner in response to a high glucose challenge, a hallmark of mature function [89]. This can be performed in both dynamic (perfusion) and static immersion systems.
Detailed Static GSIS Protocol for iPSC-Derived β-Cells
The following protocol is adapted for clusters of iPSC-derived islet-like structures (SC-islets) and can be performed in a standard tissue culture lab.
Workflow Overview:
Materials & Reagents:
- KRBH Buffer: Krebs-Ringer bicarbonate HEPES buffer (125 mM NaCl, 1.2 mM MgSO₄, 1.2 mM CaCl₂, 22 mM NaHCO₃, 10 mM HEPES, 1.19 mM KH₂PO₄), pH 7.4. Must be freshly prepared and warmed to 37°C [91].
- BSA: Fatty-acid-free Bovine Serum Albumin (0.1% in KRBH) [91].
- Glucose Solutions: Prepare stocks of D-glucose for low (2 mM) and high (20 mM) concentrations in KRBH + 0.1% BSA [91].
- Lysis Buffer: A suitable buffer (e.g., RIPA buffer) for extracting cellular insulin to determine total content.
- Insulin ELISA Kit: A highly sensitive and specific kit for human insulin (e.g., Mercodia or Millipore) [91].
Step-by-Step Procedure:
- Pre-incubation: Wash the SC-islets twice with warm KRBH + 0.1% BSA. Subsequently, incubate them in KRBH with a low glucose concentration (2 mM) for 2 hours at 37°C, 5% CO₂. This critical step depletes residual insulin and synchronizes the cellular response [91].
- Basal Insulin Secretion: After pre-incubation, carefully aspirate the buffer. Add fresh KRBH with low glucose (2 mM) and incubate for 1 hour. Collect the supernatant and store it at -20°C for the measurement of basal insulin secretion.
- Stimulated Insulin Secretion: Without disturbing the cell pellet, add KRBH with a high glucose concentration (20 mM) and incubate for another 1 hour. Collect and store this supernatant for the measurement of glucose-stimulated insulin secretion.
- Total Insulin Extraction: Lyse the cells in an appropriate lysis buffer to determine the total insulin content. This is essential for normalizing secretion data.
- Insulin Quantification: Measure insulin in all collected samples (basal, stimulated, and total) using the human insulin ELISA kit according to the manufacturer's instructions.
Data Analysis and Interpretation:
Calculate the Stimulation Index (SI) as follows:
SI = (Insulin secreted at High Glucose) / (Insulin secreted at Low Glucose)
A higher SI indicates better glucose-responsive function. For primary islets, an SI of 2-10 is typical; SC-β cells should be benchmarked against this range. Data should be normalized to total insulin content or cellular DNA to account for differences in cell number. The impact of functional maturity is starkly demonstrated in studies where epigenetic perturbations, such as KDM4A knockdown, can reduce the stimulation index by up to 80% [10].
Table 1: Representative GSIS Data from iPSC-Derived β-Cells
| Cell Type / Condition | Basal Secretion (Low Glucose) | Stimulated Secretion (High Glucose) | Stimulation Index (SI) |
|---|---|---|---|
| Functional SC-β cells | 0.5 - 2.0 ng insulin/μg DNA/hr | 2.0 - 10.0 ng insulin/μg DNA/hr | 3.0 - 7.0 |
| KDM4A-KD SC-β cells [10] | ~0.4 ng insulin/μg DNA/hr | ~0.5 ng insulin/μg DNA/hr | ~1.2 (80% reduction) |
| Immature SC-β cells | High, variable | Low, non-responsive | Often < 2.0 |
Calcium Flux Assay in β-Cells
Calcium influx is a key second messenger in the glucose-stimulated insulin secretion pathway. In mature β-cells, a rise in intracellular ATP from glucose metabolism leads to the closure of ATP-sensitive K⁺ (KATP) channels, membrane depolarization, and the opening of voltage-dependent Ca²⁺ channels (VDCC). The resulting surge in cytosolic Ca²⁺ ([Ca²⁺]ᵢ) triggers the exocytosis of insulin granules [90].
Protocol for Calcium Imaging in SC-Islets
This protocol uses a ratiometric fluorescent dye like Fura-2-AM to track changes in [Ca²⁺]ᵢ in response to glucose.
Workflow Overview:
Materials & Reagents:
- Calcium-Sensitive Dye: Fura-2-AM or Fluo-4-AM, prepared in anhydrous DMSO with Pluronic F-127 to aid dispersion.
- Imaging Setup: An inverted epifluorescence or confocal microscope equipped with a thermostatic chamber (37°C), a high-speed camera, and a precise perfusion system. For Fura-2, a dual-excitation system (340/380 nm) is required.
- Buffers: KRBH buffer, identical to that used in GSIS, with low (2 mM) and high (20 mM) glucose.
Step-by-Step Procedure:
- Dye Loading: Incubate SC-islets in KRBH with low glucose (2 mM) containing 2-5 µM Fura-2-AM for 30-60 minutes at 37°C, protected from light.
- Wash and De-esterification: Thoroughly wash the cells with dye-free KRBH and incubate for an additional 20-30 minutes to allow for complete de-esterification of the AM ester groups inside the cell.
- Image Acquisition: Mount the cells on the microscope stage. Using a 20x objective, focus on a cluster of cells. Set up time-lapse acquisition, alternating between 340 nm and 380 nm excitation while collecting emission at >500 nm. Establish a baseline by perfusing with low glucose KRBH for 5-10 minutes.
- Glucose Stimulation: Rapidly switch the perfusate to high glucose (20 mM) KRBH and continue recording for 15-20 minutes to capture the characteristic oscillatory or sustained increase in [Ca²⁺]ᵢ.
- Data Analysis: Calculate the ratio of fluorescence (F₃₄₀/F₃₈₀) for each time point. This ratio is proportional to [Ca²⁺]ᵢ and minimizes artifacts from uneven dye loading or cell thickness. Plot the ratio over time to visualize the kinetic response.
Data Analysis and Interpretation: A robust calcium flux in response to high glucose is a sign of a mature and connected metabolic signaling pathway. Key parameters to analyze include:
- Response Latency: The time between stimulus application and the initial Ca²⁺ rise.
- Oscillation Pattern: Mature β-cells often exhibit rhythmic [Ca²⁺]ᵢ oscillations, which are driven by metabolic cycles.
- Response Amplitude: The magnitude of the ratio change.
The development of advanced analysis methods, including machine learning software, is simplifying the quantification of these complex kinetic responses in heterogeneous cell populations [90] [92]. Disrupted, absent, or poorly coordinated calcium signals indicate immaturity or dysfunction in the glucose signaling pathway of the SC-β cells.
Table 2: Key Research Reagent Solutions for Functional β-Cell Assays
| Reagent / Resource | Function / Application | Example |
|---|---|---|
| KRBH Buffer | Physiologically balanced salt solution that maintains cell viability and function during acute secretion assays. | 125 mM NaCl, 1.2 mM CaCl₂, 10 mM HEPES [91]. |
| Human Insulin ELISA | Quantifies insulin concentration in cell culture supernatants with high specificity and sensitivity. | Mercodia Human Insulin ELISA, Millipore ELISA Kit [91]. |
| Calcium-Sensitive Dyes | Fluorescent indicators that bind free Ca²⁺, allowing real-time visualization of cytosolic Ca²⁺ dynamics. | Fura-2-AM (rationetric), Fluo-4-AM (single wavelength) [90]. |
| Key Transcription Factor Antibodies | Immunostaining to confirm β-cell identity and maturation status prior to functional testing. | Anti-PDX1, Anti-NKX6.1, Anti-NeuroG3 [4] [10]. |
| iPSC Line | The starting cellular material for differentiation. Patient-specific lines enable disease modeling. | 20b iPSCs (Harvard Stem Cell Institute) [10]. |
| Epigenetic Modulators | Tools to investigate and overcome epigenetic barriers to β-cell maturation. | shRNA for KDM4A knockdown [10]. |
The rigorous functional assessment of iPSC-derived β-cells using GSIS and calcium flux assays is non-negotiable for advancing diabetes research towards clinical applications. These assays provide complementary data: GSIS measures the ultimate functional output, while calcium imaging reveals the integrity of the proximal signaling cascade. As protocols evolve, the integration of these functional readouts with molecular data—such as the critical role of epigenetic regulators like KDM4A—will be essential for unlocking the full therapeutic potential of stem cell-derived islets. The consistent application of these standardized assays across the research community will ensure reliable benchmarking and accelerate progress in the field.
The generation of insulin-producing β cells from human pluripotent stem cells (hPSCs) represents a promising avenue for cell replacement therapy in diabetes [61]. Despite significant advances in differentiation protocols, the resulting stem cell-derived β cells (SC-β cells) remain functionally and transcriptionally immature compared to their primary adult counterparts [93] [94]. A precise understanding of the relationship between SC-β cells and primary β cells across human development is crucial for improving differentiation strategies. This Application Note details a comprehensive framework for the comparative single-cell RNA sequencing (scRNA-seq) analysis of SC-β cells, primary fetal β cells, and primary adult β cells. We provide standardized protocols and analytical workflows to enable researchers to rigorously benchmark SC-β cell identity and maturation state, thereby accelerating the development of more effective diabetes therapies.
Core Findings from Comparative Transcriptomic Analysis
Integrated analysis of scRNA-seq datasets reveals that while SC-β cells share a core β-cell transcriptional identity with both primary fetal and adult β cells, they exhibit a distinct transcriptional profile characterized by persistent expression of progenitor and neural-biased gene networks [93].
Table 1: Key Transcriptional Features of β Cells Across Maturation States
| Feature | SC-β Cells | Primary Fetal β Cells | Primary Adult β Cells |
|---|---|---|---|
| Core Identity Genes | INS, IAPP, DLK1, PDX1, HADH, PCSK1 [93] | INS, IAPP, DLK1, PDX1, HADH, PCSK1 [93] | INS, IAPP, DLK1, PDX1, HADH, PCSK1 [93] |
| Maturation Markers | Low/absent: G6PC2, IAPP, HADH, UCN3, CHGB, ADCYAP1, SIX3 [93] | Intermediate | High: G6PC2, IAPP, HADH, UCN3, CHGB, ADCYAP1, SIX3 [93] |
| Unique Signature | Persistent progenitor/neural network expression; TPH1+ FEV+ DDC+ enterochromaffin-like (EC) cells present [93] | Presence of neural signature; polyhormonal cell population [93] | Mature endocrine identity; absence of neural/EC signatures [93] |
| Chromatin State | Less defined; open chromatin regions associated with non-β lineages [95] | Not analyzed in this study | Highly defined; lineage-specific chromatin accessibility [95] |
| Response to Transplantation | Drastic transcriptional maturation; upregulation of INS, MAFA, CHGB, G6PC2 [94] | Not analyzed in this study | Stable identity |
Experimental Protocols
Protocol 1: Integrated scRNA-seq Atlas Construction for Islet Cell Identification
This protocol describes the integration of multiple scRNA-seq datasets to define a unified transcriptional landscape for identifying and comparing islet endocrine cell types.
Workflow Diagram: Integrated scRNA-seq Analysis
Required Materials:
- Hardware: High-performance computing cluster, NovaSeq 6000 sequencer (or equivalent)
- Software: CellRanger, Seurat, Conos, R/Bioconductor environments
- Reagents: 10x Genomics Chromium Single Cell 3' Reagent Kit, collagenase D for tissue dissociation, magnetic bead-based mouse cell depletion kit (for transplantation studies)
Procedure:
- Data Collection and Quality Control: Collect published scRNA-seq datasets from SC-islets (multiple protocols), primary adult islets, and primary fetal islets [93]. Process raw data and perform quality control to remove dead cells (high mitochondrial content) and sequencing doublets.
- Preliminary Clustering: Perform unsupervised clustering on each dataset individually. Generate Uniform Manifold Approximation and Projection (UMAP) plots for visualization.
- Endocrine Cell Isolation: Isolate clusters expressing high levels of chromogranin A (CHGA) as endocrine cells, narrowing the analysis from a total of ~128,000 pancreatic cells to ~60,000 CHGA+ cells [93].
- Data Integration: Integrate all CHGA+ cells to identify shared cell populations across datasets. This typically reveals 10 unique endocrine populations: β, α, PP, δ, ε, proliferating endocrine, endocrine progenitors (Prog), enterochromaffin-like (EC), neuroendocrine (NE), and polyhormonal (Poly) cells [93].
- Cell Type Annotation: Validate cell populations by high expression of canonical hormones (INS, GCG, SST, PPY, GHRL) and enrichment of cell-specific markers.
- Core Identity Gene Definition: Identify genes enriched in β-cells compared to all other endocrine cells. Define conserved identity genes (e.g., INS, IAPP, DLK1) shared across all tissue sources [93].
Protocol 2: Multi-omic Analysis of Chromatin and Transcriptional States
This protocol employs single-nucleus multi-omic sequencing to simultaneously profile gene expression and chromatin accessibility, providing deeper insights into lineage specification deficiencies in SC-islets.
Workflow Diagram: Single-Nucleus Multi-omic Profiling
Required Materials:
- Hardware: 10x Genomics Chromium Controller, Illumina sequencer
- Software: Cell Ranger ARC, Seurat, Signac, Monocle 3
- Reagents: 10x Genomics Single Cell Multiome ATAC + Gene Expression kit, SC-islets from directed differentiation
Procedure:
- Nuclei Isolation: Prepare single-nucleus suspensions from SC-islets and primary human islets.
- Library Preparation and Sequencing: Process samples using the Single Cell Multiome ATAC + Gene Expression kit to generate paired transcriptome (snRNA-seq) and chromatin accessibility (snATAC-seq) libraries. Sequence on an Illumina platform.
- Integrated Data Analysis: Analyze gene expression and chromatin accessibility data both individually and in combination. This integrated approach can reveal subpopulations, such as distinct SC-EC cell states, not apparent from transcriptome data alone [95].
- Transcription Factor Motif Analysis: Identify transcription factor-binding motifs enriched in the chromatin accessibility profiles of each cell type. Cross-reference with transcription factor mRNA expression to identify "active" transcription factors driving cell identity [95].
- Trajectory Analysis: Perform trajectory inference analysis on the combined mRNA and ATAC data to investigate continuous cell states, such as the gradient between SC-β and SC-EC cells [95].
Signaling Pathways and Gene Regulatory Networks in β-Cell Maturation
The transcriptional immaturity of SC-β cells is characterized by the dysregulation of key gene networks. The following diagram synthesizes the major pathways and processes identified through differential Gene Coordination Network Analysis (dGCNA) and other comparative studies.
Pathway Diagram: Gene Networks in β-Cell Identity and Maturation
This integrative view shows that the path to a mature β cell state involves the suppression of neural/progenitor programs, the proper coordination of core metabolic and secretory pathways, and the in vivo environmental cues provided by transplantation.
The Scientist's Toolkit: Essential Research Reagents and Solutions
Table 2: Key Reagents for SC-β Cell Differentiation and Characterization
| Reagent / Tool Category | Specific Example | Function / Application | Key Findings Enabled |
|---|---|---|---|
| Synthetic Gene Networks | Vanillic acid-programmable lineage-control network [84] | Programs dynamic expression of Ngn3 (OFF-ON-OFF), Pdx1 (ON-OFF-ON), and MafA (OFF-ON) in hiPSCs. | Generation of glucose-sensitive insulin-secreting β-like cells with release dynamics comparable to human islets. |
| Multi-omic Sequencing Kits | 10x Genomics Single Cell Multiome ATAC + Gene Expression [95] | Simultaneous profiling of gene expression and chromatin accessibility in single nuclei. | Revealed gradient of cell states between SC-β and SC-EC cells; identified lineage-specific transcription factor activity. |
| Cell Type Markers (Antibodies) | Anti-CHGA, Anti-NKX6.1, Anti-C-peptide, Anti-GCG [94] | Identification and validation of pancreatic endocrine cell types via immunostaining and FACS. | Confirmed presence of key endocrine cell types in SC-islets pre- and post-transplantation. |
| Computational Tools | dGCNA (differential Gene Coordination Network Analysis) [85] | Network-based analysis of scRNA-seq data to identify cell type-specific, disease-perturbed gene modules. | Identified 11 T2D-perturbed networks in β-cells (e.g., mitochondrial ETC, glycolysis, UPR). |
| In Vivo Maturation Model | Kidney capsule transplantation into STZ-induced diabetic mice [94] | Provides in vivo microenvironment to assess SC-β cell functional maturation and diabetes reversal. | Demonstrated drastic transcriptional maturation of SC-β cells, including upregulation of MAFA and G6PC2. |
The protocols and analyses detailed herein provide a robust framework for the comparative assessment of SC-β cells against their primary counterparts. Key takeaways for researchers in the field are that SC-β cells, while sharing a core β-cell identity, exhibit a distinct transcriptional profile reminiscent of a developmentally immature state, characterized by persistent neural/progenitor gene networks and the presence of off-target enterochromaffin-like cells. The integration of scRNA-seq with multi-omic chromatin accessibility data is crucial for uncovering the regulatory deficiencies underlying these immature states. Furthermore, transplantation studies confirm that SC-β cells retain significant plasticity and can mature in an appropriate in vivo environment. By adopting these standardized comparative approaches, the field can systematically identify the precise transcriptional and epigenetic barriers to β-cell maturation, ultimately guiding the development of optimized differentiation protocols that yield fully functional SC-β cells for clinical application.
Within the broader scope of research on differentiating induced pluripotent stem cells (iPSCs) into insulin-producing beta cells, the critical step that transitions this technology from an in vitro assay to a potential therapeutic is successful in vivo validation. This document details the application notes and protocols for transplanting stem cell-derived islets (SC-islets) into animal models, with the primary goal of achieving restoration of normoglycemia in diabetic subjects. The process assesses the functional maturation, engraftment efficiency, and long-term efficacy of the generated beta cells, providing indispensable preclinical data for drug development and clinical translation. The following sections summarize key quantitative outcomes, provide detailed surgical protocols, illustrate critical signaling pathways, and list essential research reagents.
Recent preclinical and clinical studies have demonstrated the profound potential of iPSC-derived islets to reverse diabetes. The table below summarizes the quantitative outcomes from pivotal studies, highlighting the efficacy of different transplantation models.
Table 1: Key Outcomes from In Vivo Transplantation Studies of SC-Islets
| Study Model | Transplantation Site | Time to Normoglycemia | Key Functional Metrics | Reference |
|---|---|---|---|---|
| CiPSC-islets in Human (Phase I Trial) | Abdominal anterior rectus sheath | Insulin independence achieved by Day 75 | TIR: >98%; HbA1c: ~5.0%; Stimulated C-peptide detected | [62] [68] |
| iPSC-derived Islets in Diabetic NSG Mice | Kidney capsule / Bioengineered iVEP | Restoration of normoglycemia post-engraftment | Physiologic insulin secretion; Improved graft survival & vascularization | [96] |
| iPSC-derived Islets in NOD-SCID Mice | Kidney capsule | Glucose-responsive after in vivo maturation | Modulation of human insulin secretion in response to secretagogues | [6] |
TIR: Time-in-Range; iVEP: iPSC-based Vascularized Endocrine Pancreas.
Detailed Experimental Protocols
Protocol 1: Generation of Islet-like Aggregates from Human iPSCs
This protocol is adapted from methods that successfully generated functional, transplantable islet-like organoids [6] [40].
- Objective: To direct the differentiation of human iPSCs into 3D islet-like aggregates containing insulin-producing beta cells.
Key Principles: The protocol mimics in vivo pancreatic development through sequential activation and inhibition of key signaling pathways. A critical advancement is the use of 3D culture systems to promote correct cell polarity and cell-to-cell communication, which are crucial for full beta cell functionality [6].
Stepwise Differentiation Workflow:
- Maintenance of iPSCs: Culture human iPSCs on Matrigel-coated plates in E8 medium. Passage cells at ~80% confluency using Accutase. Ensure mycoplasma-free status [6].
- Definitive Endoderm Induction (Stage 1-2):
- Day 0-1: Activate Nodal/Activin A signaling using Activin A (100 ng/mL) and WNT signaling using CHIR99021 (a GSK3-β inhibitor, typically 3-6 µM) in a base medium lacking FGF2 [40].
- Day 1-3: Continue with Activin A in low-serum media.
- Validation: >90% of cells should express definitive endoderm markers SOX17 and FOXA2 by flow cytometry.
- Pancreatic Progenitor Specification (Stage 3-4):
- Day 3-7: Inhibit Sonic hedgehog (SHH) signaling using KAAD-cyclopamine (e.g., 0.25 µM). Add Retinoic Acid (RA, e.g., 2 µM) and FGF10 (e.g., 50 ng/mL) to promote posterior foregut and pancreatic progenitor fate [97] [40].
- Validation: High co-expression of PDX1 and NKX6-1 by immunostaining indicates successful pancreatic progenitor formation.
- Endocrine Differentiation & Aggregation (Stage 5-7):
- Day 7-14: Detach cells and transfer to 3D aggregation culture. Use static microwells (e.g., AggreWell400) for homogeneous, small-sized aggregates (~750 cells/microwell) to prevent central necrosis [6].
- Continue differentiation with factors that promote endocrine fate, such as TGF-β pathway modulators and BMP inhibitors [6].
- Islet Maturation (Stage 7+):
- Culture aggregates in media containing factors like Alk5i (a TGF-β receptor inhibitor) and T3 (Thyroid hormone) to enhance functional maturation [6].
Protocol 2: Transplantation and In Vivo Validation in Diabetic Mice
This protocol outlines the procedure for transplanting SC-islets into a diabetic mouse model to assess their ability to restore normoglycemia.
- Objective: To evaluate the in vivo function and engraftment of SC-islets in an immunocompromised diabetic mouse model.
Animal Model: NOD-SCID or NSG mice are rendered diabetic by a single high-dose intraperitoneal injection of Streptozotocin (STZ) (e.g., 180-200 mg/kg). Mice with persistent non-fasting blood glucose >350 mg/dL for two consecutive measurements are selected for transplantation [6] [96].
Transplantation Procedure:
- Preparation of SC-Islets: Harvest differentiated islet-like aggregates. Rinse and resuspend in a cold, sterile transplantation medium (e.g., DMEM with 10 µM ROCK inhibitor) [6].
- Anesthesia and Analgesia: Anesthetize the mouse using an approved regimen (e.g., isoflurane inhalation). Provide pre-operative analgesia (e.g., buprenorphine).
- Surgical Transplantation (Kidney Capsule):
- Position the mouse in lateral recumbency.
- Make a small dorsal incision to expose the kidney.
- Using a fine catheter (e.g., 27G) attached to a Hamilton syringe, carefully inject ~2-5 million SC-islet cell equivalents beneath the kidney capsule.
- Ensure the graft is deposited as a single bolus. Apply gentle pressure to prevent bleeding.
- Suture the muscle layer and close the skin with wound clips [6] [96].
- Alternative Site: Bioengineered Scaffold:
- For bioengineered constructs like the iPSC-based Vascularized Endocrine Pancreas (iVEP), the scaffold containing SC-islets and endothelial cells is transplanted into a surgically accessible site, such as the epididymal fat pad or abdominal wall [96].
Post-Transplantation Monitoring:
- Glycemic Monitoring: Measure non-fasting blood glucose levels 3 times per week. Normoglycemia is typically defined as blood glucose <200 mg/dL.
- Intraperitoneal Glucose Tolerance Test (IPGTT): Perform at defined endpoints (e.g., 2-3 months post-transplant). After a fast (e.g., 6h), administer glucose (e.g., 2 g/kg body weight) intraperitoneally and measure blood glucose at 0, 15, 30, 60, 90, and 120 minutes.
- Human C-peptide Measurement: Collect plasma samples during IPGTT to measure glucose-stimulated human C-peptide secretion via ELISA, confirming the graft's functional response [6].
- Histological Analysis: At the study endpoint, explant the graft and fix for histological analysis. Stain for Insulin, Glucagon, CD31 (vasculature), and Caspase-3 (apoptosis) to assess graft survival, composition, and integration [96].
Signaling Pathways and Experimental Workflow
The differentiation and functional maturation of iPSCs into beta cells is governed by a tightly regulated sequence of signaling events. The following diagram summarizes the core pathway.
Diagram 1: Signaling Pathway for SC-Islet Differentiation. This diagram outlines the key stages and primary signaling molecules used to direct iPSCs toward functional, transplant-ready islet aggregates.
The entire process from cell culture to functional validation in vivo involves a multi-stage workflow, as illustrated below.
Diagram 2: In Vivo Validation Workflow. This workflow charts the key experimental stages from the initial culture of induced pluripotent stem cells (iPSCs) through to final endpoint analysis after transplantation (Tx) into a diabetic mouse model.
The Scientist's Toolkit: Essential Research Reagents
Successful execution of the described protocols relies on a defined set of high-quality reagents and materials. The following table catalogs the essential solutions for this field of research.
Table 2: Key Research Reagent Solutions for iPSC-Derived Islet Validation
| Reagent/Material | Function / Application | Example |
|---|---|---|
| Small Molecule Inducers/Inhibitors | Precisely control key signaling pathways during differentiation. | CHIR99021 (WNT activator), KAAD-cyclopamine (SHH inhibitor), Retinoic Acid (Posterior foregut patterning) [97] [40] |
| Growth Factors & Cytokines | Guide cell fate decisions by mimicking developmental signals. | Activin A (Definitive endoderm), FGF10 (Gut tube/pancreatic progenitor), BMP Inhibitors (Endocrine specification) [97] [6] |
| 3D Culture Systems | Promote self-organization into islet-like architecture with proper cell polarity. | AggreWell Plates (for uniform aggregate formation), Matrigel (as a natural scaffold) [6] |
| Immunodeficient Mouse Models | Provide a permissive in vivo environment for engraftment of human cells without rejection. | NOD-SCID, NSG mice [6] [96] |
| Beta Cell Maturation Factors | Enhance functional maturation of SC-islets, both in vitro and in vivo. | T3 (Thyroid Hormone), Alk5i (TGF-β receptor inhibitor) [6] |
| Streptozotocin (STZ) | A chemical agent that selectively ablates pancreatic beta cells, enabling creation of a diabetic mouse model for transplantation studies. | N/A [6] [96] |
Characterizing the Persistent Neural and Progenitor Signature in SC-β Cells
The generation of stem cell-derived beta cells (SC-β cells) from human induced pluripotent stem cells (iPSCs) represents a transformative approach for diabetes treatment, disease modeling, and drug development [3] [1]. Despite significant advances in differentiation protocols, a recurring challenge is the persistent presence of off-target cell populations, including those exhibiting neural and progenitor characteristics, within the final islet products [98]. This residual signature poses potential risks for clinical applications, including teratoma formation and impaired graft function, while also providing insights into the developmental pathways shared by pancreatic and neural lineages [52] [98]. Therefore, comprehensive characterization of these populations is essential for ensuring the safety and efficacy of SC-β cell therapies.
The presence of neural-like cells in SC-islet differentiations likely reflects the close developmental relationship between pancreatic and neural tissues [52]. During embryonic development, both lineages utilize similar transcriptional regulators and signaling pathways, creating potential for divergent differentiation. Understanding and controlling these residual signatures is crucial for advancing SC-β cells toward clinical applications, particularly for type 1 diabetes treatment where millions of patients could benefit from cell replacement therapies [3] [1].
This application note provides detailed methodologies for identifying, quantifying, and characterizing persistent neural and progenitor signatures in SC-β cell differentiations, enabling researchers to improve differentiation efficiency and ensure product safety.
Background and Significance
The Developmental Landscape of Pancreatic and Neural Lineages
Pancreatic development proceeds through precisely orchestrated stages governed by key transcription factors. PDX1, a homeodomain transcription factor, serves as the cornerstone of pancreatic organogenesis, initiating formation of both ventral and dorsal pancreatic primordia [52]. NKX6.1 plays a complementary role in maintaining β-cell functional maturity, while NEUROG3 acts as a master regulator of endocrine commitment [52]. NEUROD1, a downstream target of NEUROG3, maintains the mature phenotype of pancreatic β-cells and regulates insulin gene expression [52].
The neural lineage shares several transcriptional regulators with pancreatic endocrine development, creating potential for cross-lineage differentiation. The persistence of neural progenitor markers in SC-β cell differentiations may reflect incomplete specification or activation of alternative developmental pathways [98]. Single-cell RNA sequencing has revealed substantial cellular heterogeneity in SC-islet preparations, identifying populations expressing neural progenitor markers alongside endocrine cells [99] [67].
Current Challenges in SC-β Cell Generation
The main impediment for clinical use of SC-islets remains concerns about safety due to off-target growth resulting from contaminated residual cells [98]. These off-target populations include not only neural progenitors but also enterochromaffin-like cells, pancreatic exocrine cells, and various progenitor states [67] [98]. Recent single-cell transcriptomic analyses of SC-islets during differentiation and after implantation have provided crucial insights into the diversity of these residual populations and their potential impacts on graft function and safety [67] [98].
Table 1: Key Transcription Factors in Pancreatic and Neural Development
| Transcription Factor | Primary Lineage Role | Function | Consequence of Mutation |
|---|---|---|---|
| PDX1 | Pancreatic | Initiates pancreatic budding; regulates β-cell maturation and insulin expression | Pancreatic agenesis (homozygous); MODY4 (heterozygous) |
| NEUROG3 | Pancreatic/Neural | Master regulator of endocrine commitment; activates downstream transcription factors | Blocks endocrine differentiation (complete knockout); enteric anendocrinosis |
| NEUROD1 | Pancreatic/Neural | Regulates insulin gene expression; maintains mature β-cell phenotype | Neonatal diabetes; MODY6 |
| NKX6.1 | Pancreatic | Specifies β-cell identity; maintains functional maturity | Impaired insulin secretion; diabetes susceptibility |
| SOX2 | Neural | Maintains neural progenitor identity; pluripotency factor | Neural tube defects; anophthalmia |
Experimental Protocols for Characterization
Single-Cell RNA Sequencing for Comprehensive Profiling
Purpose: To identify and characterize heterogeneous cell populations, including residual neural and progenitor signatures, within SC-β cell differentiations at single-cell resolution.
Materials:
- Single-cell RNA sequencing platform (10X Genomics recommended)
- Viability stain (Propidium Iodide or DAPI)
- Cell suspension buffer (PBS + 0.04% BSA)
- Library preparation kit
- Bioanalyzer or TapeStation for quality control
Procedure:
- Sample Preparation: Harvest SC-β cells at terminal differentiation stage (typically day 25-35 of differentiation). Dissociate clusters to single cells using gentle enzymatic digestion (TrypLE Select recommended).
- Quality Control: Assess cell viability using trypan blue exclusion or automated cell counters. Ensure viability >85% for optimal sequencing results.
- Cell Suspension Preparation: Resuspend cells at 700-1,200 cells/μL in ice-cold cell suspension buffer. Filter through 40μm flow cytometry strainer to remove aggregates.
- Library Preparation: Load cells onto single-cell platform according to manufacturer's instructions. Target 5,000-10,000 cells per sample to ensure adequate representation of rare populations.
- Sequencing: Sequence libraries to a depth of 50,000 reads per cell minimum on Illumina platform.
- Data Analysis:
- Process raw data using Cell Ranger pipeline for alignment and barcode assignment.
- Perform quality control filtering to remove cells with <500 genes detected or >10% mitochondrial reads.
- Conduct dimensionality reduction (PCA, UMAP) and clustering (Louvain algorithm) to identify distinct cell populations.
- Identify cluster-specific markers using differential expression testing (Wilcoxon rank-sum test).
- Project data against reference datasets of primary human islets and neural tissues to identify aberrant expression patterns.
Troubleshooting:
- Low viability: Optimize dissociation protocol; include Rho-kinase inhibitor (Y-27632) during dissociation.
- High mitochondrial reads: Indicates cellular stress; optimize culture conditions prior to harvesting.
- Low sequencing saturation: Increase sequencing depth or improve library complexity.
Table 2: Key Marker Genes for Identifying Off-Target Populations in SC-β Cells
| Cell Population | Key Marker Genes | Expected Expression in Pure SC-β Cells | Potential Risk |
|---|---|---|---|
| Mature SC-β Cells | INS, PDX1, NKX6-1, MAFA, IAPP | High | Benchmark population |
| Neural Progenitors | SOX2, NES, PAX6, SOX1, TUBB3 | Absent/Low | Teratoma formation; aberrant signaling |
| Enterochromaffin-like Cells | SLC18A1, TPH1, HTR3B | Absent/Low | Serotonin secretion; gastrointestinal side effects |
| Pancreatic Progenitors | SOX9, HES1, ONECUT1 | Low (transient) | Continued differentiation; heterogeneity |
| Immature Endocrine | NEUROD1, NEUROG3, CHGA | Low | Functional immaturity |
Immunohistochemical Validation of Neural Signatures
Purpose: To spatially localize and quantify neural and progenitor populations within SC-islet clusters.
Materials:
- Primary antibodies: Anti-SOX2 (neural progenitor), Anti-TUBB3 (neuronal), Anti-INS (β-cells), Anti-NKX6-1 (β-cell maturity)
- Secondary antibodies with fluorophore conjugates (Alexa Fluor recommended)
- Mounting medium with DAPI
- Confocal microscope with 20x, 40x, and 63x objectives
- Image analysis software (Imaris, ImageJ, or equivalent)
Procedure:
- Sample Fixation: Fix SC-islet clusters in 4% paraformaldehyde for 15 minutes at room temperature.
- Permeabilization and Blocking: Permeabilize with 0.3% Triton X-100 for 10 minutes, then block with 5% normal donkey serum for 1 hour.
- Antibody Incubation: Incubate with primary antibodies diluted in blocking buffer overnight at 4°C. Use the following recommended dilutions: SOX2 (1:500), TUBB3 (1:1000), INS (1:500), NKX6-1 (1:300).
- Washing and Secondary Detection: Wash 3x with PBS, then incubate with species-appropriate secondary antibodies (1:1000) for 1 hour at room temperature, protected from light.
- Mounting and Imaging: Mount clusters on glass slides using anti-fade mounting medium. Image using confocal microscopy with sequential scanning to avoid bleed-through.
- Quantitative Analysis:
- Count SOX2+ and TUBB3+ cells within multiple random fields (minimum 10 fields per replicate).
- Calculate percentage of neural marker-positive cells relative to total DAPI+ cells.
- Assess spatial distribution of neural populations relative to insulin+ clusters.
- Perform colocalization analysis to identify double-positive cells.
Validation: Include appropriate controls: primary human islets (negative control for neural markers), neural stem cells (positive control), and omission of primary antibody (negative control).
Functional Assessment of Neural Properties
Purpose: To evaluate functional neural characteristics in residual populations within SC-islet clusters.
Calcium Imaging Protocol:
- Dye Loading: Incubate SC-islet clusters with Fura-2 AM (5μM) or Fluo-4 AM (2μM) in culture medium for 30-45 minutes at 37°C.
- Perifusion System Setup: Transfer clusters to a perifusion chamber with continuous flow (0.5mL/min) of Krebs-Ringer Bicarbonate buffer.
- Stimulus Application:
- Baseline: 2.8mM glucose for 10 minutes
- Neural Stimulus: 50mM KCl for 5 minutes (depolarization)
- Recovery: 2.8mM glucose for 10 minutes
- Positive Control: 16.7mM glucose for 15 minutes
- Image Acquisition: Capture images at 2-second intervals using fluorescence microscope with appropriate filters.
- Data Analysis: Calculate fluorescence ratios (F340/F380 for Fura-2) or ΔF/F for Fluo-4. Identify responsive cells and characterize response kinetics.
Electrophysiological Characterization:
- Patch Clamp Setup: Use standard whole-cell patch clamp configuration on identified neural-like cells.
- Solution Composition: External solution (in mM): 140 NaCl, 5 KCl, 2 CaCl₂, 1 MgCl₂, 10 HEPES, 5 glucose (pH 7.4). Internal solution: 130 K-gluconate, 10 KCl, 2 MgCl₂, 0.5 CaCl₂, 5 EGTA, 10 HEPES (pH 7.2).
- Protocols:
- Current-clamp: Measure membrane potential and action potential firing in response to current injection.
- Voltage-clamp: Characterize voltage-gated sodium, potassium, and calcium currents.
- Data Analysis: Analyze action potential parameters (threshold, amplitude, frequency) and current-voltage relationships.
The Scientist's Toolkit: Research Reagent Solutions
Table 3: Essential Research Reagents for Characterizing Neural and Progenitor Signatures
| Reagent Category | Specific Products | Application | Key Features |
|---|---|---|---|
| Transcriptional Regulators | PDX1 Antibody [52], NKX6.1 Antibody [52], NEUROG3 Antibody [52] | Immunostaining, Western Blot | Validate pancreatic specification; assess maturity |
| Neural Markers | SOX2 Antibody [100], TUBB3 (βIII-Tubulin) Antibody [99], NES (Nestin) Antibody [100] | Identify neural progenitors; quantify contamination | Specific for neural lineage commitment |
| Cell Sorting Markers | CD133/Prom1 [100], CD24 [98], CD49f (Integrin α6) [98] | FACS isolation of progenitor populations | Enrich/deplete specific subpopulations |
| Functional Assay Kits | Fura-2 AM [67], Fluo-4 AM [67], ATP Lite Assay | Calcium imaging; viability assessment | Monitor functional activity; metabolic status |
| Single-Cell Analysis | 10X Genomics Chromium [99], Parse Biosciences Kit [67] | scRNA-seq library preparation | Comprehensive transcriptional profiling |
| Culture Additives | ROCK Inhibitor (Y-27632) [67], ZM447439 [67], NAC [67] | Improve viability; enhance maturation | Reduce proliferation; prevent cell death |
Data Analysis and Interpretation Framework
Quantitative Assessment of Residual Signatures
Establishing threshold levels for residual neural and progenitor populations is critical for quality control. Based on current literature, the following benchmarks represent acceptable levels in clinical-grade SC-β cell differentiations:
- SOX2+ neural progenitor cells: <1% of total population
- TUBB3+ neuronal cells: <0.5% of total population
- SLC18A1+ enterochromaffin-like cells: <5% of total population
- Proliferating (Ki-67+) endocrine cells: <0.5% of INS+ cells
These thresholds should be established through standardized protocols with appropriate controls and validation across multiple differentiation batches.
Correlation with Functional Outcomes
Analysis of the relationship between residual signature levels and SC-β cell function provides critical insights for process optimization:
- Glucose-Stimulated Insulin Secretion: SC-islets should exhibit biphasic insulin secretion with stimulation index >2 and appropriate glucose threshold (≈5mM) [67].
- Gene Expression Profiles: Compare with primary human islet benchmarks using single-cell RNA sequencing [99] [67].
- In Vivo Function: Assess glucose homeostasis restoration in diabetic mouse models with correlation to residual signature levels.
Comprehensive characterization of persistent neural and progenitor signatures in SC-β cell differentiations is essential for advancing these therapeutic products toward clinical application. The integrated experimental approaches outlined in this application note—combining single-cell transcriptomics, spatial validation through immunohistochemistry, and functional assessments—provide a robust framework for identifying and quantifying these residual populations.
As differentiation protocols continue to evolve toward greater efficiency and purity [67] [1], the persistent neural signature represents both a challenge for safety and an opportunity to understand the fundamental biology of cellular reprogramming and differentiation. By implementing these characterization methods as standard quality control measures, researchers can systematically improve SC-β cell products while ensuring their safety profile meets the rigorous standards required for clinical translation in diabetes treatment.
The ongoing optimization of differentiation protocols, particularly through small molecule interventions like ZM447439 and NAC that reduce proliferative off-target cells [67], combined with rigorous characterization of residual signatures, will accelerate the development of safe and effective SC-β cell therapies for diabetes.
Conclusion
The differentiation of iPSCs into insulin-producing beta cells has progressed from a scientific concept to a tangible therapeutic prospect with significant potential to revolutionize diabetes treatment. While foundational knowledge and multi-stage protocols have enabled the generation of functional beta-like cells, challenges remain in achieving full maturity, ensuring safety, and scaling production. Validation studies confirm that stem cell-derived beta cells share a core identity with their primary counterparts but require further refinement. Future research must focus on enhancing in vitro maturation, developing effective encapsulation or immune-evasive strategies to prevent rejection, and conducting large-scale clinical trials. The convergence of gene editing, advanced biomaterials, and single-cell technologies promises to accelerate the development of a robust, curative cell therapy for diabetes, moving this promising field from the laboratory to the clinic.
References
- 1. Differentiation of Human Pluripotent Cells into Pancreatic ... [https://www.mdpi.com/1422-0067/26/17/8749]
- 2. Differentiation of Human Pluripotent Cells into Pancreatic ... [https://pubmed.ncbi.nlm.nih.gov/40943666/]
- 3. Global research dynamics in the induced pluripotent stem ... [https://pmc.ncbi.nlm.nih.gov/articles/PMC12272591/]
- 4. A perfect islet: reviewing recent protocol developments and ... [https://stemcellres.biomedcentral.com/articles/10.1186/s13287-025-04293-7]
- 5. Applications of iPSC-derived beta cells from patients with ... [https://www.sciencedirect.com/science/article/pii/S2666379121000549]
- 6. In depth functional characterization of human induced ... [https://pmc.ncbi.nlm.nih.gov/articles/PMC9428245/]
- 7. Generation and Characterization of iPSC-derived Insulin- ... [https://www.rndsystems.com/resources/literature/generation-and-characterization-of-ipsc-derived-pancreatic-beta-islets]
- 8. Generation of stem cell-derived β-cells from patients with ... [https://www.nature.com/articles/ncomms11463]
- 9. Identifying and optimizing critical process parameters for large ... [https://stemcellres.biomedcentral.com/articles/10.1186/s13287-024-03973-0]
- 10. Deciphering the epigenetic role of KDM4A in pancreatic β- ... [https://www.frontiersin.org/journals/endocrinology/articles/10.3389/fendo.2025.1697097/full]
- 11. Comparing ESC and iPSC—Based Models for Human ... [https://pmc.ncbi.nlm.nih.gov/articles/PMC4470175/]
- 12. Induced pluripotent stem cells (iPSCs) [https://www.nature.com/articles/s41392-024-01809-0]
- 13. Stem cell derived exosome trilogy: an epic comparison of ... [https://stemcellres.biomedcentral.com/articles/10.1186/s13287-025-04440-0]
- 14. Induced Pluripotent Stem Cell (iPSC) Industry Trends for ... [https://bioinformant.com/ipsc-industry-trends/]
- 15. Proteomic and functional comparison between human ... [https://elifesciences.org/reviewed-preprints/92025v1/pdf]
- 16. Applications of iPSC-derived beta cells from patients with ... [https://pmc.ncbi.nlm.nih.gov/articles/PMC8080107/]
- 17. Stem cells differentiation into insulin-producing cells (IPCs) [https://stemcellres.biomedcentral.com/articles/10.1186/s13287-022-02977-y]
- 18. Generation of insulin-producing pancreatic β cells ... - PubMed [https://pubmed.ncbi.nlm.nih.gov/34349281/]
- 19. Induced Pluripotent Stem Cells Market Size 2025 to 2034 [https://www.precedenceresearch.com/induced-pluripotent-stem-cells-market]
- 20. Induced Pluripotent Stem Cells (iPSCs) Market Prospects ... [https://www.businesswire.com/news/home/20251111238841/en/Induced-Pluripotent-Stem-Cells-iPSCs-Market-Prospects-2025-2033-Industry-Gains-Traction-with-Rising-Investments-and-Collaborations---ResearchAndMarkets.com]
- 21. for Protocol modeling of specification and morphogenesis of... in vitro [https://pubmed.ncbi.nlm.nih.gov/40402748/]
- 22. Deciphering early human pancreas development at the ... [https://www.nature.com/articles/s41467-023-40893-8]
- 23. Frontiers | Identification of mouse and human embryonic ... pancreatic [https://www.frontiersin.org/journals/endocrinology/articles/10.3389/fendo.2025.1543960/full]
- 24. Organogenesis from Dispersed Mouse In ... Vitro Pancreas Embryonic [https://www.jove.com/pl/t/51725/in-vitro-pancreas-organogenesis-from-dispersed-mouse-embryonic]
- 25. Comparative Study of Two Common In Vitro Models for the ... [https://pmc.ncbi.nlm.nih.gov/articles/PMC9852380/]
- 26. PDX1, Neurogenin-3, and MAFA: critical transcription ... [https://pmc.ncbi.nlm.nih.gov/articles/PMC5667467/]
- 27. Revealing transcription factors during human pancreatic β cell ... [https://pmc.ncbi.nlm.nih.gov/articles/PMC4167784/]
- 28. Forward programming of hiPSCs towards beta-like cells ... [https://www.nature.com/articles/s41598-024-64346-4]
- 29. The SWI/SNF chromatin remodelling complex regulates ... [https://pubmed.ncbi.nlm.nih.gov/38958700/]
- 30. Dynamic Chromatin Remodeling Mediated by Polycomb ... [https://www.sciencedirect.com/science/article/pii/S1934590912007060]
- 31. Direct Reprogramming of Human Cells into Insulin Producers [https://esmed.org/direct-reprogramming-of-human-cells-into-insulin-producers/]
- 32. Differentiation of Human Pluripotent Cells into Pancreatic Beta ... [https://pmc.ncbi.nlm.nih.gov/articles/PMC12429797/]
- 33. Efficient Generation of Induced Pluripotent Stem Cell ... [https://pmc.ncbi.nlm.nih.gov/articles/PMC12153844/]
- 34. Chemically defined and growth factor-free system for highly ... [https://www.sciencedirect.com/science/article/pii/S2213671124003266]
- 35. Differentiation of induced pluripotent stem cells (iPSCs) ... [https://qkine.com/application-note/differentiation-of-induced-pluripotent-stem-cells-ipscs-into-endoderm/]
- 36. GRP94 is Indispensable for Definitive Endoderm ... [https://www.sciencedirect.com/science/article/pii/S1525001625002990]
- 37. 4.16. Definitive Endoderm Differentiation [https://bio-protocol.org/exchange/minidetail?id=8186082&type=30]
- 38. In silico modeling of directed differentiation of induced ... [https://journals.plos.org/ploscompbiol/article?id=10.1371/journal.pcbi.1013407]
- 39. Scale up manufacturing approach for production of human ... [https://www.nature.com/articles/s41536-025-00409-y]
- 40. Stepwise differentiation of functional pancreatic β cells from ... [https://cellregeneration.springeropen.com/articles/10.1186/s13619-022-00125-8]
- 41. Insulin/Glucose-Responsive Cells Derived from Induced ... [https://pmc.ncbi.nlm.nih.gov/articles/PMC7696367/]
- 42. From iPSCs to Pancreatic β Cells: Unveiling Molecular ... [https://www.mdpi.com/1422-0067/25/17/9654]
- 43. Directed differentiation of pancreatic δ cells from human ... [https://www.nature.com/articles/s41467-024-50611-7]
- 44. Comparative analysis of small molecule and growth factor ... [https://www.frontiersin.org/journals/cell-and-developmental-biology/articles/10.3389/fcell.2025.1594340/full]
- 45. Real-time observation of pancreatic beta cell differentiation ... [https://pmc.ncbi.nlm.nih.gov/articles/PMC6614661/]
- 46. Cellartis human iPS cell-derived beta cells for diabetes ... [https://www.takarabio.com/learning-centers/stem-cell-research/technical-notes/beta-cells/beta-cells-for-disease-modeling?srsltid=AfmBOopqk6c6lUTA0_KO_f5Xyd5kdt8wbIFoVebQZ5ttVYXiQacGSOGW]
- 47. Shaping Pancreatic β-Cell Differentiation and Functioning [https://pmc.ncbi.nlm.nih.gov/articles/PMC7072458/]
- 48. 2D vs 3D Cell Culture: Choosing the Right Model [https://www.tempobioscience.com/2d-vs-3d-cell-culture-choosing-the-right-model-by-tempo-bioscience/]
- 49. In depth functional characterization of human induced ... [https://www.frontiersin.org/journals/cell-and-developmental-biology/articles/10.3389/fcell.2022.967765/full]
- 50. Efficient and reproducible generation of human iPSC ... [https://www.nature.com/articles/s41467-024-50224-0]
- 51. Protocol to generate stem cell-derived alpha cells in 3D ... [https://pmc.ncbi.nlm.nih.gov/articles/PMC12491158/]
- 52. A perfect islet: reviewing recent protocol developments and ... [https://pmc.ncbi.nlm.nih.gov/articles/PMC11959787/]
- 53. Induced pluripotent stem cells : An overview | Abcam [https://www.abcam.com/en-us/knowledge-center/stem-cells/induced-pluripotent-stem-cells]
- 54. Therapies for Type 1 Diabetes: Current Scenario and ... [https://pmc.ncbi.nlm.nih.gov/articles/PMC6501476/]
- 55. The role of the beta cell in type 2 diabetes - PubMed Central [https://pmc.ncbi.nlm.nih.gov/articles/PMC12423227/]
- 56. In-silico modelling of insulin secretion and pancreatic beta ... [https://www.frontiersin.org/journals/clinical-diabetes-and-healthcare/articles/10.3389/fcdhc.2024.1452400/full]
- 57. Advancing diabetes management: Exploring pancreatic beta - cell ... [https://pmc.ncbi.nlm.nih.gov/articles/PMC11525866/]
- 58. Drug Discovery Models and Toxicity Testing Using Embryonic ... [https://pmc.ncbi.nlm.nih.gov/articles/PMC3357635/]
- 59. Differentiation of patient-specific induced pluripotent stem ... [https://pmc.ncbi.nlm.nih.gov/articles/PMC12305229/]
- 60. Pancreatic α and β cells are globally phase-locked [https://www.nature.com/articles/s41467-022-31373-6]
- 61. Stem cell-derived pancreatic beta cells: a step closer to ... [https://bmcendocrdisord.biomedcentral.com/articles/10.1186/s12902-025-01997-y]
- 62. Transplantation of chemically induced pluripotent stem-cell ... [https://www.sciencedirect.com/science/article/pii/S0092867424010225]
- 63. Encapsulated stem cell–derived β cells exert glucose ... [https://www.nature.com/articles/s41587-023-02055-5]
- 64. The future of type 1 diabetes: Can stem cells provide a cure? [https://www.eurekalert.org/news-releases/1107525]
- 65. The Last Mile in Beta-Cell Replacement Therapy for Type 1 ... [https://www.frontierspartnerships.org/journals/transplant-international/articles/10.3389/ti.2025.14565/full]
- 66. The progress of pluripotent stem cell-derived pancreatic β- ... [https://www.frontiersin.org/journals/endocrinology/articles/10.3389/fendo.2022.927324/full]
- 67. Functional, metabolic and transcriptional maturation of ... [https://www.nature.com/articles/s41587-022-01219-z]
- 68. Stem cell-derived pancreatic beta cells - PubMed Central - NIH [https://pmc.ncbi.nlm.nih.gov/articles/PMC12265369/]
- 69. Navigating challenges in human pluripotent stem cell- ... [https://pmc.ncbi.nlm.nih.gov/articles/PMC12358281/]
- 70. Clinical translation of human iPSC technologies: advances ... [https://www.frontiersin.org/journals/cell-and-developmental-biology/articles/10.3389/fcell.2025.1627149/full]
- 71. Clinical translation of human iPSC technologies [https://pmc.ncbi.nlm.nih.gov/articles/PMC12498231/]
- 72. Possible Strategies to Reduce the Tumorigenic of... Risk [https://www.mdpi.com/1422-0067/25/10/5177]
- 73. Exploring Genetic Stability in iPSCs [https://pluristyx.com/exploring-genetic-stability-in-ipscs/]
- 74. Applications of 3D Bioprinted-Induced Pluripotent Stem ... [https://pmc.ncbi.nlm.nih.gov/articles/PMC7557348/]
- 75. Recent advances in the development of bioartificial ... [https://www.explorationpub.com/Journals/em/Article/1001184]
- 76. Three-Dimensional Bioreactor Technologies for the ... [https://pmc.ncbi.nlm.nih.gov/articles/PMC5872596/]
- 77. In vitro Characterization of Insulin−Producing β-Cell ... [https://www.frontiersin.org/journals/cell-and-developmental-biology/articles/10.3389/fcell.2020.623889/full]
- 78. Three-dimensional culture and bioreactors for cellular ... [https://www.sciencedirect.com/science/article/abs/pii/S1465324911705163]
- 79. State of the Art of Bioengineering Approaches in Beta-Cell ... [https://pmc.ncbi.nlm.nih.gov/articles/PMC12055624/]
- 80. Three-dimensional bioprinting of functional β-islet-like constructs [https://pmc.ncbi.nlm.nih.gov/articles/PMC10090816/]
- 81. Optimization and Validation of a Custom-Designed ... [https://www.frontiersin.org/journals/bioengineering-and-biotechnology/articles/10.3389/fbioe.2022.811942/full]
- 82. Validating expression of beta cell maturation-associated ... [https://www.frontiersin.org/journals/cell-and-developmental-biology/articles/10.3389/fcell.2023.1103719/full]
- 83. Charting cellular identity during human in vitro β-cell ... [https://pmc.ncbi.nlm.nih.gov/articles/PMC6903417/]
- 84. A programmable synthetic lineage-control... | Nature Communications [https://www.nature.com/articles/ncomms11247?error=cookies_not_supported&code=afdf19b5-291d-44c0-bec5-d19211552666]
- 85. Single-cell mRNA-regulation analysis reveals cell type ... [https://www.nature.com/articles/s41467-025-65060-z]
- 86. Pancreatic islet β-cell subtypes are derived from ... [https://www.nature.com/articles/s41467-025-60831-0]
- 87. Endocrine Disrupting Chemical Exposure During ... [https://pubmed.ncbi.nlm.nih.gov/41264466/]
- 88. Expression of Progenitor Cell Markers During Expansion of ... [https://pmc.ncbi.nlm.nih.gov/articles/PMC6009112/]
- 89. Protocol for in vivo and ex vivo assessments of glucose- ... [https://www.sciencedirect.com/science/article/pii/S2666166721004354]
- 90. A technique for evaluating calcium flux in primary airway ... [https://sciety-labs.elifesciences.org/articles/by?article_doi=10.1101/2025.09.05.674539]
- 91. Glucose-stimulated insulin secretion (GSIS) assay [https://bio-protocol.org/exchange/minidetail?id=1515448&type=30]
- 92. A Novel Method for Analyzing [Ca2+] Flux Kinetics in High- ... [https://www.sciencedirect.com/science/article/pii/S2472555222084854]
- 93. Comparative and integrative single cell analysis reveals new ... [https://bmcgenomics.biomedcentral.com/articles/10.1186/s12864-024-10013-x]
- 94. Single-Cell Transcriptome Profiling Reveals β ... [https://pmc.ncbi.nlm.nih.gov/articles/PMC7491368/]
- 95. Single-nucleus multi-omics of human stem cell-derived ... [https://www.nature.com/articles/s41556-023-01150-8]
- 96. Bioengineering of a human iPSC-derived vascularized ... [https://www.sciencedirect.com/science/article/pii/S2666379125000114]
- 97. Islet Cell Replacement and Regeneration for Type 1 Diabetes [https://pmc.ncbi.nlm.nih.gov/articles/PMC11906537/]
- 98. Review Characterization of stem-cell-derived islets during ... [https://www.sciencedirect.com/science/article/pii/S2211124722010555]
- 99. Single-cell transcriptomic and genomic changes in the ... [https://www.nature.com/articles/s41586-025-09435-8]
- 100. Neural Stem Cell Relay from B1 to B2 cells in the adult ... [https://pmc.ncbi.nlm.nih.gov/articles/PMC11979704/]