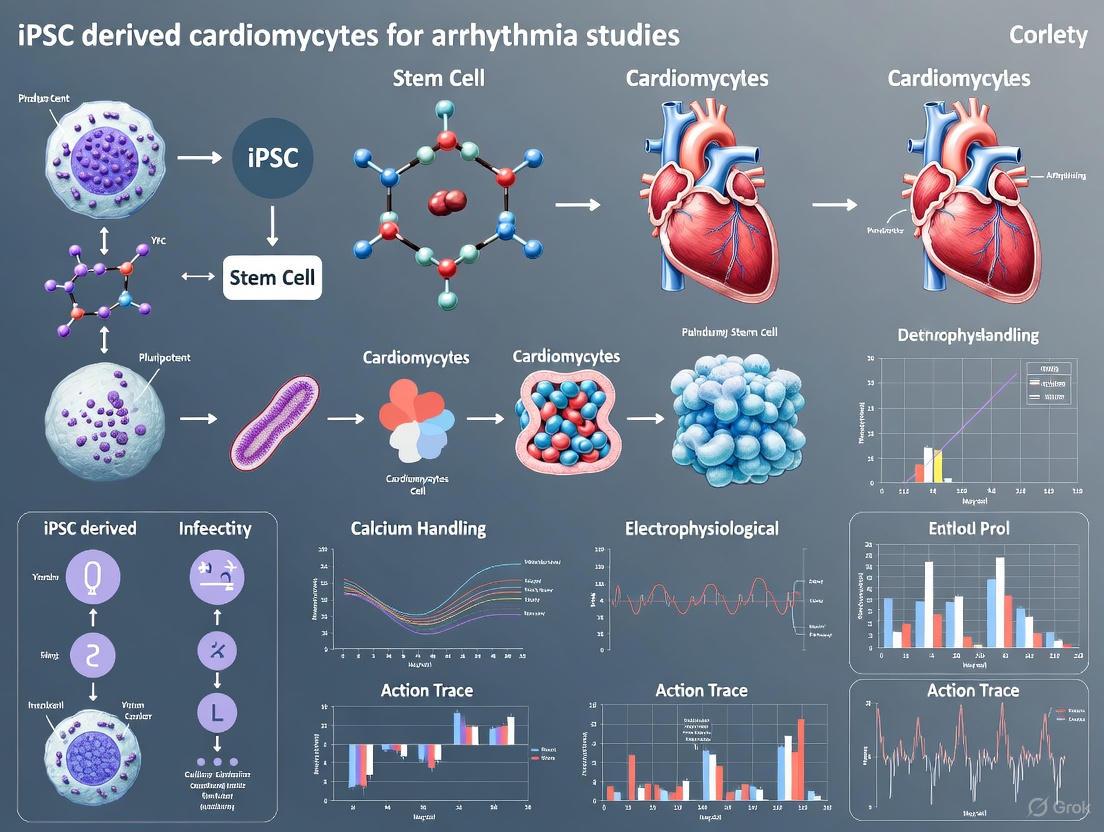
iPSC-Derived Cardiomyocytes for Arrhythmia Studies: From Disease Modeling to Clinical Translation
Induced pluripotent stem cell-derived cardiomyocytes (iPSC-CMs) have revolutionized cardiac arrhythmia research by providing a patient-specific platform for disease modeling, drug screening, and safety pharmacology.
iPSC-Derived Cardiomyocytes for Arrhythmia Studies: From Disease Modeling to Clinical Translation
Abstract
Induced pluripotent stem cell-derived cardiomyocytes (iPSC-CMs) have revolutionized cardiac arrhythmia research by providing a patient-specific platform for disease modeling, drug screening, and safety pharmacology. This article comprehensively examines the current landscape, exploring the foundational biology of iPSC-CMs, their methodological applications in heart-on-a-chip systems and engineered tissues, persistent challenges regarding cellular immaturity and arrhythmogenic risk, and validation strategies against clinical and animal data. By synthesizing advances across these domains, we highlight how iPSC-CMs are enabling personalized therapeutic approaches while addressing critical barriers to their clinical translation for arrhythmia studies.
Understanding iPSC-CM Biology and Arrhythmia Modeling Fundamentals
Human induced pluripotent stem cell-derived cardiomyocytes (iPSC-CMs) have emerged as a transformative platform in cardiovascular research, particularly for modeling inherited cardiac arrhythmia syndromes and uncovering human-specific disease mechanisms [1]. By reprogramming patient-specific somatic cells into cardiomyocytes, this technology provides an unparalleled tool for disease modeling, drug discovery, and personalized medicine approaches [2] [3]. The ability to generate cardiomyocytes that inherit the genetic background of individual patients has created unprecedented opportunities to study arrhythmogenic diseases in vitro, enabling researchers to bridge basic discovery with translational applications [1] [3].
Key Reprogramming and Differentiation Methodologies
Evolution of Culture and Differentiation Protocols
The methods for cardiomyocyte differentiation of human iPSCs have evolved from complex, uncontrolled systems to simplified and relatively robust protocols [4]. Initial differentiation approaches relied on spontaneous differentiation of stem cells aggregated into embryoid bodies with fetal bovine serum, yielding only about 8% spontaneously contracting embryoid bodies [4]. Modern protocols, informed by developmental biology cues, now utilize defined growth factors and small molecules to direct differentiation efficiently.
Current differentiation strategies typically employ programmed activation and then inhibition of the Wnt signaling pathway, which has become the dominant approach due to its relative simplicity and high efficiency [5]. This method can be performed in either two-dimensional monolayer cultures or three-dimensional suspension formats, each with distinct advantages and limitations [5].
Monolayer vs. Suspension Culture Systems
Table 1: Comparison of iPSC-CM Differentiation Methods
| Parameter | Monolayer Differentiation | Suspension Bioreactor Differentiation |
|---|---|---|
| Scalability | Limited, scales linearly with culture plate area | Highly scalable from 2.5 to 1000 mL cultures [5] |
| Yield | Lower yield [5] | ~1.21 million cells/mL at ~94% purity [5] |
| Batch Variability | Higher intra- and inter-batch variability [5] | More reproducible across batches [5] |
| Functional Properties | Less mature functional properties [5] | More mature functional properties [5] |
| Cryopreservation Impact | Negative impact on contraction, electrophysiology, and drug responses [5] | High viability (>90%) after cryo-recovery [5] |
| Onset of Contraction | Differentiation day 7 [5] | Differentiation day 5 [5] |
| Cost Considerations | Lower equipment costs | Higher equipment costs, though magnetically stirred spinner flasks offer economical alternatives [5] |
Optimized Suspension Culture Protocol
Recent advances in suspension culture systems have addressed many limitations of monolayer approaches. An optimized stirred suspension protocol incorporates several key features [5]:
- Use of quality-controlled master cell banks to ensure consistency of input hiPSCs
- Employment of stirred bioreactors that continuously monitor and adjust temperature, O2, CO2, and pH
- Utilization of small molecules rather than growth factors to reduce costs and lot-to-lot variation
- Optimization of the timing for Wnt activation and inhibition
- Implementation of controlled freeze and thaw protocols
This bioreactor approach produces predominantly ventricular cardiomyocytes and demonstrates more mature functional properties compared to monolayer-differentiated cells [5]. The protocol has been successfully applied across multiple different iPSC lines, including both donor-derived and gene-edited lines [5].
Figure 1: Optimized suspension culture workflow for iPSC-CM differentiation. The protocol emphasizes critical quality control points and temporal modulation of Wnt signaling.
The Scientist's Toolkit: Essential Research Reagents
Table 2: Key Research Reagents for iPSC-CM Differentiation and Culture
| Reagent Category | Specific Examples | Function |
|---|---|---|
| Culture Media | E8, B8, RPMI/B27 [4] | Maintain pluripotency or support cardiomyocyte differentiation and maturation |
| Wnt Pathway Modulators | CHIR99021 (activator), IWR-1 (inhibitor) [5] | Sequential activation and inhibition of Wnt signaling to direct cardiac differentiation |
| Extracellular Matrices | Growth-factor reduced Matrigel, Geltrex, Synthemax II-SC [4] | Provide substrate for cell attachment and growth |
| Metabolic Selection Agents | Lactate-containing media [6] | Eliminate non-cardiomyocytes through metabolic selection |
| Maturation Enhancers | Fatty acid supplements, thyroid hormone [7] [8] | Promote metabolic and structural maturation of iPSC-CMs |
| Passaging Reagents | EDTA, TrypLE, collagenase [4] | Dissociate cells for subculturing or harvesting |
| Cryopreservation Components | DMSO, defined cryopreservation media [5] | Maintain cell viability during freezing and storage |
Advanced Maturation Strategies for Enhanced Arrhythmia Modeling
A significant limitation of conventional iPSC-CMs is their immature, fetal-like nature, which restricts their ability to fully recapitulate adult cardiac disease phenotypes [7] [8]. Recent approaches have focused on combinatorial maturation strategies to address this challenge.
Integrated Maturation Protocol
A comprehensive maturation approach combining multiple stimuli has demonstrated significant improvements in iPSC-CM maturity [7]:
- Metabolic Maturation Medium: Lipid-enriched medium with high calcium concentration
- Nanopatterning: Engineered surfaces to promote structural alignment
- Electrostimulation: Paced at 2 Hz to promote electrophysiological maturation
This combined approach resulted in iPSC-CMs with more negative resting membrane potentials, increased action potential upstroke velocity, and enhanced sarcomere organization [7]. Systematic testing revealed that electrostimulation was the key driver of enhanced mitochondrial development and metabolic maturation, while nanopatterning primarily facilitated sarcomere organization [7].
Metabolic Maturation
Cardiac metabolism undergoes significant changes during development, with immature iPSC-CMs relying predominantly on aerobic glycolysis rather than oxidative phosphorylation [8]. Maturation strategies targeting metabolic pathways include:
- Supplementation with fatty acids to promote mitochondrial oxidative capacity
- Hormone cocktails to mimic postnatal metabolic shifts
- Prolonged culture time to enable spontaneous maturation
- Electrical pacing to increase energy demand and drive metabolic adaptation
Figure 2: Combinatorial maturation strategy for iPSC-CMs showing primary drivers and secondary effects of different maturation stimuli.
Applications in Inherited Arrhythmia Modeling
iPSC-CMs have proven particularly valuable for modeling inherited cardiac arrhythmias, including long QT syndrome (LQTS), Brugada syndrome (BrS), catecholaminergic polymorphic ventricular tachycardia (CPVT), and short QT syndrome (SQTS) [2] [3]. These disease models recapitulate key pathological features observed in patients:
- Long QT Syndrome Models: Demonstrate prolonged action potential duration, reduced IKs current, and early afterdepolarizations [2]
- Brugada Syndrome Models: Show reductions in sodium current peak density and abnormal calcium transients [2]
- CPVT Models: Exhibit aberrant diastolic calcium release and arrhythmias under adrenergic stimulation [2]
The patient-specific nature of iPSC-CMs makes them especially suitable for investigating diseases with incomplete penetrance and variable expressivity, as they retain the complete genetic background of the donor [3]. Furthermore, when combined with CRISPR/Cas9 gene editing, they enable the establishment of isogenic controls and causal validation of genetic variants [3].
Troubleshooting and Quality Control Considerations
Successful implementation of iPSC-CM protocols requires careful attention to quality control measures. Key considerations include:
- Input Cell Quality: High differentiation efficiencies (>90% cardiomyocytes) correlate with high pluripotency marker expression (SSEA4 >70%) in input iPSCs [5]
- Embryoid Body Size Control: Optimal differentiation requires embryoid bodies between 100-300μm diameter; smaller structures disassemble while larger ones differentiate less efficiently due to diffusion limits [5]
- Line-to-Line Variability: Different iPSC lines may exhibit inconsistent differentiation efficiency, necessitating protocol optimization for specific lines [5]
- Functional Validation: Comprehensive characterization should include electrophysiological assessment, calcium handling properties, and structural analysis to confirm cardiomyocyte identity and maturity [7]
By addressing these critical factors and implementing robust quality control measures, researchers can enhance the reproducibility and translational relevance of their iPSC-CM models for arrhythmia studies.
Human induced pluripotent stem cell-derived cardiomyocytes (iPSC-CMs) have emerged as a transformative platform for modeling cardiac arrhythmias, personalized drug screening, and elucidating disease mechanisms. These cells retain the patient-specific genetic background, providing an unparalleled window into inherited cardiac channelopathies [9]. A comprehensive understanding of their inherent electrophysiological characteristics—spanning the ion channels that govern excitability and the action potential (AP) morphology that integrates their function—is fundamental to employing these cells effectively in both basic research and preclinical applications. This Application Note details the core electrophysiological properties of iPSC-CMs and provides standardized protocols for their assessment, framed within the context of arrhythmia research.
Core Electrophysiological Properties of iPSC-CMs
The utility of iPSC-CMs in predicting proarrhythmic risk and modeling disease is codified in initiatives like the Comprehensive in vitro Proarrhythmia Assay (CiPA) [10]. Their electrophysiological profile is defined by a complex interplay of ionic currents, which collectively shape the action potential and determine cellular excitability.
Key Ion Channels and Currents
The table below summarizes the major ionic currents in iPSC-CMs and their roles in shaping the action potential.
Table 1: Major Ionic Currents in iPSC-CMs and Their Functional Roles
| Ionic Current | Underlying Channel(s) | Phase of AP | Primary Role in iPSC-CMs | Notes on Maturation |
|---|---|---|---|---|
| INa (Late Sodium Current) | NaV1.5 (SCN5A) | Phase 0 (Upstroke) | Rapid depolarization; conduction velocity. | Density significantly increases in late-stage cells (>50 days), enhancing upstroke velocity [10]. |
| ICa,L (L-type Calcium Current) | CaV1.2 (CACNA1C) | Phase 2 (Plateau) | Excitation-Contraction coupling; AP duration. | Density increases with culture time, leading to larger Ca2+-transients [10]. |
| IKr (Rapid Delayed Rectifier) | hERG (KCNH2) | Phase 3 (Repolarization) | Major repolarizing current; target for drug-induced arrhythmia. | Commonly used to assess proarrhythmic risk. Gain-of-function mutations cause Short QT Syndrome [11]. |
| IKs (Slow Delayed Rectifier) | KV7.1 (KCNQ1) | Phase 3 (Repolarization) | Repolarization reserve. | Less prominent in iPSC-CMs compared to adult CMs [9]. |
| Ito (Transient Outward) | KV4.2/4.3 (KCND2/3) | Phase 1 (Early Repolarization) | "Notch" morphology; influences plateau. | Density increases with maturation protocols, enabling adult-like "notch-and-dome" morphology [7]. |
| IK1 (Inward Rectifier) | Kir2.1 (KCNJ2) | Phase 4 (Resting Potential) | Sets resting membrane potential; stabilizes excitability. | Low expression is a key marker of immaturity. Density increases in older cells, shortening APD and stabilizing rhythm [10]. |
Action Potential Morphology and Maturation
iPSC-CMs typically exhibit a heterogeneous AP morphology that evolves with time in culture and is influenced by experimental conditions.
- Developmental Trajectory: iPSC-CMs demonstrate significant electrophysiological development over long-term culture (30-80 days). Key changes include a shortening of the action potential duration at 90% repolarization (APD90), a more negative maximum diastolic potential, and an increased AP upstroke velocity, largely driven by increased IK1 and INa densities [10].
- Impact of Culture Density: Seeding density critically affects AP morphology. Sparsely seeded cells show longer, more heterogeneous APs, while confluent monolayers exhibit a normally distributed spectrum of AP durations without clear evidence of distinct chamber-specific subpopulations based on AP morphology alone [12].
- Chamber-Specific Differentiation: While naive differentiation yields a mixed population, protocols using retinoic acid can generate atrial-like iPSC-CMs. These cells demonstrate a distinctive triangular AP morphology, shorter AP duration, and increased expression of connexin 40 and the acetylcholine-sensitive potassium current (IK,ACh) compared to ventricular-like cells [11].
Table 2: Evolution of Key Action Potential Parameters with Maturation in iPSC-CMs
| Parameter | Immature iPSC-CMs (Day 30-46) | Mature iPSC-CMs (Day 47-80) | Functional Impact |
|---|---|---|---|
| Resting Membrane Potential | Less negative | More negative (e.g., -65.6 mV with advanced maturation [7]) | Reduces spontaneous automaticity, increases excitability. |
| AP Upstroke Velocity (dV/dtmax) | Lower (e.g., ~4-5 V/s) | Higher (e.g., ~11 V/s with advanced maturation [7]) | Faster conduction velocity, reduced arrhythmia vulnerability. |
| AP Amplitude | Lower | Higher | Increased excitability. |
| AP Duration at 90% Repolarization (APD90) | Longer | Shorter | More closely resembles adult CM repolarization. |
| IK1 Density | Low | Significantly increased [10] | Primary driver of RMP negativity and APD shortening. |
Experimental Protocols for Electrophysiological Assessment
Protocol 1: Whole-Cell Patch-Clamp Electrophysiology
This gold-standard technique allows for precise measurement of ionic currents and action potentials from single iPSC-CMs.
Materials & Reagents:
- Cell Preparation: Single, isolated iPSC-CMs plated on Matrigel-coated glass coverslips.
- External Solution (for INa): (in mmol/L) NaCl 5, HEPES 10, MgCl2 1, CsCl 10, Glucose 10, CaCl2 0.5, TEA-Cl 120 (pH 7.4 with CsOH) [10].
- Internal/Pipette Solution (for INa): (in mmol/L) NaCl 5, EGTA 10, GTP-Tris 0.4, HEPES 10, Mg-ATP 4, CsCl 20, CaCl2 3, Cs-Methansulfonate 90 (pH 7.2) [10].
- Equipment: Patch-clamp amplifier, micromanipulator, vibration-isolation table, data acquisition system.
Procedure:
- Cell Preparation: Plate dissociated iPSC-CMs sparsely (e.g., 15,000 cells/cm²) on coated coverslips and culture for 7-10 days prior to recording [11].
- Solution Perfusion: Place the coverslip in a recording chamber and continuously perfuse with the appropriate pre-warmed (33-37°C) external solution.
- Electrode Fabrication & Access: Pull borosilicate glass capillaries to a resistance of 2-5 MΩ. Fire-polish the tip, fill with internal solution, and establish a high-resistance seal (>1 GΩ) on the cell membrane. Compensate for capacitance and series resistance.
- Action Potential Recording (Current-Clamp Mode):
- Set the amplifier to current-clamp mode.
- Inject a brief suprathreshold current pulse (e.g., 1-2 nA for 5 ms) at a pacing frequency of 1 Hz [11].
- Record the elicited action potential. Parameters such as APD90, APD50, maximum upstroke velocity (dV/dtmax), and resting membrane potential can be analyzed offline.
- Ionic Current Recording (Voltage-Clamp Mode):
- For INa: Hold at -80 mV, apply a pre-pulse to -110 mV (1000 ms) to increase channel availability, then step from -80 mV to +20 mV in 5 mV increments [10].
- For ICa,L: Hold at -40 mV to inactivate Na+ channels, then step to test potentials from -40 mV to +60 mV.
- For IKr: Hold at -40 mV, apply depolarizing steps to various potentials, and measure the tail current upon repolarization. IKr is defined as the E4031 (5 µM)-sensitive current [11].
Protocol 2: High-Throughput Optical Action Potential Recording
This non-invasive method uses voltage-sensitive dyes or genetically encoded voltage indicators (GEVIs) to record APs from single cells or monolayers over extended periods.
Materials & Reagents:
- Genetically Encoded Voltage Indicator (GEVI) Line: AAVS1-VSFP-hiPSCs with VSFP-CR (Clover-mRuby2) knocked into the AAVS1 safe harbor locus [13].
- Differentiation: Cardiomyocyte differentiation medium (e.g., RPMI 1640 + B-27 supplement).
- Imaging Setup: Inverted epifluorescence or confocal microscope, high-speed camera, and stable environmental chamber (37°C, 5% CO₂).
Procedure:
- Cell Line Differentiation: Differentiate the AAVS1-VSFP-hiPSC line into ventricular or atrial cardiomyocytes using a directed, monolayer protocol [13].
- Plating for Assay: For 2D monolayer recordings, plate cells to form a confluent syncytium. For single-cell analysis in 2D or 3D, plate sparsely or use engineered micro-tissues.
- Optical Recording:
- Place the culture dish on the pre-warmed microscope stage.
- Excite the Clover (GFP) fluorophore at 488 nm.
- Simultaneously collect emission signals for both Clover (500-550 nm bandpass) and mRuby2 (570-620 nm bandpass) using a high-speed camera (>500 fps).
- Record spontaneous activity or pace the monolayer at a fixed frequency (e.g., 1-2 Hz) using field stimulation.
- Data Analysis:
- Calculate the FRET ratio (R = FmRuby2 / FClover) over time for each region of interest.
- The FRET ratio trace corresponds directly to the membrane potential, from which AP parameters can be extracted.
The workflow below illustrates the process of generating and validating iPSC-CMs for optical electrophysiological assessment.
Figure 1: Workflow for Optical AP Recording in iPSC-CMs.
The Scientist's Toolkit: Essential Research Reagents
Successful electrophysiological assessment relies on a suite of specialized reagents and tools.
Table 3: Essential Reagents and Tools for iPSC-CM Electrophysiology Research
| Category / Item | Specific Examples | Function / Application |
|---|---|---|
| Cell Sources | Patient-specific iPSCs, Isogenic controls (CRISPR-corrected), AAVS1-VSFP-KI reporter lines [13] [14] | Disease modeling, control for genetic background, non-invasive optical recording. |
| Differentiation Kits/Media | Commercially available differentiation kits; RPMI 1640 + B-27 supplement [10] | Efficient, reproducible generation of iPSC-CMs. |
| Maturation Media/Supplements | Lipid-supplemented maturation media (e.g., with fatty acids), Increased Calcium concentration [7] | Promotes metabolic and electrophysiological maturation. |
| Ion Channel Modulators | E4031 (IKr blocker), Nifedipine (ICa,L blocker), Carbenoxolone (gap junction blocker) [12] [11] | Pharmacological isolation of specific currents or modulation of cellular coupling. |
| Gene Editing Tools | CRISPR/Cas9 for knock-in/knock-out [9] [14] | Creating isogenic controls, introducing disease mutations, inserting reporters. |
| Extracellular Matrix | Matrigel, Fibronectin, Micropatterned/ Nanopatterned surfaces [7] [14] | Supports cell attachment, spreading, and promotes structural maturation. |
| Electrostimulation Systems | C-Pace EM system or similar | Provides rhythmic electrical pacing to promote maturation and enable steady-state measurements. |
iPSC-CM Maturation Strategies for Enhanced Electrophysiology
The fetal-like phenotype of standard iPSC-CMs remains a key limitation. Integrated maturation strategies are required to achieve adult-like electrophysiology. A combined approach using metabolic medium (MM), nanopatterning (NP), and electrostimulation (ES) has been shown to comprehensively promote maturation [7].
The diagram below illustrates how these key stimuli interact to drive distinct aspects of the maturation process.
Figure 2: Integrated Strategy for iPSC-CM Maturation.
A deep and methodical understanding of the electrophysiological characteristics of iPSC-CMs is non-negotiable for their effective application in arrhythmia research and drug development. While challenges related to immaturity and heterogeneity persist, the standardized protocols and maturation strategies detailed herein provide a robust framework for generating high-quality, physiologically relevant electrophysiological data. The continued refinement of these methods, coupled with the integration of patient-specific models and high-throughput technologies, promises to deepen our understanding of arrhythmogenic mechanisms and accelerate the development of novel, safer therapeutics.
Induced pluripotent stem cell-derived cardiomyocytes (iPSC-CMs) represent a transformative tool for disease modeling, drug screening, and regenerative therapy for cardiac arrhythmias. However, a significant challenge limiting their translational application is their characteristic structural and functional immaturity, which differs substantially from adult cardiomyocytes (AdCMs). This application note provides a detailed comparative analysis of these differences, framed within the context of arrhythmia research, and presents standardized protocols to quantify and mitigate this immaturity gap. The inherent fetal-like phenotype of iPSC-CMs contributes to arrhythmogenic risks, a critical consideration for their use in both basic research and clinical applications [15] [16] [17]. This document outlines the key morphological, electrophysiological, and metabolic distinctions, supported by quantitative data, and provides actionable experimental methodologies to advance research in this field.
Comparative Analysis: iPSC-CMs vs. Adult Cardiomyocytes
The following tables summarize the key quantitative and qualitative differences between iPSC-CMs and adult cardiomyocytes across structural, functional, and metabolic domains. These differences collectively contribute to the proarrhythmic potential of iPSC-CMs.
Table 1: Structural and Morphological Comparisons
| Parameter | iPSC-CMs | Adult Cardiomyocytes | Functional Implication |
|---|---|---|---|
| Cell Morphology | Small, rounded (3,000-6,000 μm³) [17] | Elongated, rod-shaped (~40,000 μm³) [17] | Poor force generation, disorganized conduction |
| Sarcomere Organization | Poorly organized, random orientation [17] | Highly aligned, parallel myofibrils [17] | Reduced contractile force and efficiency |
| Sarcomere Length | Shorter (1.7-2.0 μm) [17] | Longer (1.9-2.2 μm) [17] | Altered contractile dynamics |
| T-Tubule Network | Absent or rudimentary [17] | Highly developed, regular network [17] | Spatially uncoupled Ca2+ release, impaired E-C coupling |
| Mitochondria | Small, sparse cristae, glycolytic metabolism [17] | Large, dense cristae, oxidative phosphorylation [17] | Reduced energy production, inability to meet adult metabolic demands |
| Predominant MHC Isoform | α-myosin heavy chain (αMHC) [17] | β-myosin heavy chain (βMHC) [17] | Isoform switch impacts contractile speed and force |
Table 2: Electrophysiological and Calcium Handling Properties
| Parameter | iPSC-CMs | Adult Cardiomyocytes | Arrhythmogenic Consequence |
|---|---|---|---|
| Resting Membrane Potential | Depolarized (≈-50 to -60 mV) [16] | Hyperpolarized (≈-80 to -90 mV) [16] | Reduced availability of Na+ channels, slow conduction |
| Spontaneous Automaticity | Present (Pacemaker-like) [16] | Absent in ventricular CMs [16] | Ectopic focal activity, graft-induced tachyarrhythmias [18] |
| Major Repolarizing Currents | Altered expression; dependent on IKr [9] [17] | Robust IK1, IKr, IKs [9] [17] | Prolonged and variable Action Potential Duration (APD) |
| Excitation-Contraction Coupling | Delayed Ca2+-induced Ca2+ release (CICR) [17] | Rapid, synchronous CICR [17] | Arrhythmogenic calcium waves, delayed afterdepolarizations (DADs) |
| Conduction Velocity | Slower [16] | Faster (~0.5 m/s) | A substrate for re-entrant arrhythmias |
Experimental Protocols for Functional Maturation and Analysis
Protocol: Quantifying Cardiomyocyte Maturity via scRNA-seq Entropy Score
A critical step in maturation studies is the objective quantification of the maturity state. This protocol uses a single-cell RNA sequencing (scRNA-seq)-based metric to generate a reproducible "entropy score" [19].
- Objective: To establish a quantitative, transcriptome-based metric for assessing the maturation level of individual PSC-CMs, enabling cross-study comparisons.
- Principle: The metric calculates the Shannon Entropy of gene expression, which decreases as cells transition from a pluripotent, high-entropy state to a differentiated, low-entropy cardiomyocyte state [19].
Procedure:
- Software Installation (Timing: 10 min)
- Install R (v4.1.2 or higher) and RStudio.
- Install required R packages:
ggplot2,reshape2,Matrix,dplyr, andsingleCellNetusing theinstall.packages()command. - Download the file "entropy_functions.R" from the designated GitHub repository (https://github.com/skannan4/cm-entropy-score) [19].
Data Preparation (Timing: 5 min)
- Generate a single-cell RNA-seq counts matrix and a corresponding phenotype table from your iPSC-CM sample.
- Ensure data quality: a minimum sequencing depth of 2,000 counts per cell is required. Exclude low-quality cells by setting an appropriate threshold for the percentage of mitochondrial reads [19].
Execution in R (Timing: 5 min)
- Set the working directory to the folder containing "entropy_functions.R".
- Load the required functions and datasets into the R workspace using the
source()andload()commands. - Run the core function to calculate entropy scores for each cell in your dataset.
Interpretation
- Lower entropy scores indicate a more mature transcriptional profile. The scores can be benchmarked against a provided reference dataset of primary mouse cardiomyocytes from embryonic day 14 to postnatal day 84 [19].
Diagram 1: Entropy Score Analysis Workflow
Protocol: Functional Maturation via Chronic Electrical Pacing
Immature iPSC-CMs exhibit a negative force-frequency relationship (FFR), a hallmark of fetal tissue. This protocol describes a rapid method to elicit a mature, positive FFR using electrical stimulation.
- Objective: To enhance the functional maturity of iPSC-CMs, specifically their contractile and calcium handling properties, within 48 hours.
- Principle: Chronic electrical pacing at a physiological frequency mimics in vivo stress, promoting metabolic, structural, and electrophysiological adaptations that drive maturation [20].
Procedure:
- Cell Plating (Timing: 2 hours)
- Plate iPSC-CMs (e.g., CDI iCell CM2) onto a multi-electrode array (MEA) plate, such as the CytoView MEA 24, to achieve a confluent, spontaneously beating monolayer.
Chronic Pacing (Timing: 48 hours)
- Place the MEA plate into an instrument with integrated environmental control and pacing capabilities (e.g., Maestro Edge).
- Initiate chronic electrical pacing at 2 Hz for a duration of 48 hours.
Functional Assessment (Timing: 2 hours)
- After 48 hours, assess the force-frequency relationship by pacing the cells at a range of frequencies (e.g., 0.8 Hz to 3 Hz) and measuring the beat amplitude via impedance-based contractility recording.
- Validate maturity by testing the response to positive inotropes like isoproterenol. A dose-dependent increase in beat amplitude indicates a functionally mature phenotype [20].
Diagram 2: Functional Maturation by Pacing
Protocol: Generating Aligned Cardiomyocytes for Enhanced Contractility Assessment
Cell alignment is a key feature of mature myocardium. This protocol uses nanopatterned surfaces to create structurally aligned iPSC-CM cultures for more predictive contractility assays.
- Objective: To create structurally aligned hiPSC-CM cultures that exhibit enhanced contractile function and more physiological responses to inotropic agents.
- Principle: Micro- and nano-scale ridge-groove patterns on culture surfaces provide topographical cues that guide cell orientation and cytoskeletal organization, promoting a more adult-like structure [21].
Procedure:
- Surface Preparation (Timing: 1 hour)
- Culture hiPSC-CMs on a 96-well plate with a ridge-groove-ridge nanopattern on the bottom surface. Use a standard 96-well plate for non-aligned control cultures.
Culture and Differentiation (Timing: As per differentiation protocol)
- Differentiate iPSCs into cardiomyocytes according to established protocols directly on the nanopatterned surface.
Validation and Analysis (Timing: 3 hours)
- Imaging: Confirm cell alignment using microscopy.
- qPCR: Validate enhanced maturity by measuring the increased expression of genes related to contractility (e.g., myosin heavy chain, calcium channels, ryanodine receptor).
- Functional Assay: Use motion analysis software to measure contractility parameters. Aligned cultures will demonstrate higher contraction/relaxation velocities and a more robust response to inotropic agents like isoproterenol and verapamil compared to non-aligned controls [21].
The Scientist's Toolkit: Essential Research Reagents and Platforms
Table 3: Key Reagents and Platforms for iPSC-CM Maturation and Arrhythmia Studies
| Item | Function/Application | Example/Catalog |
|---|---|---|
| Multi-Electrode Array (MEA) System | All-optical electrophysiology; measures field potential, conduction velocity, and contractility; enables chronic electrical pacing. | Maestro Edge (Axion Biosystems) [20] |
| Nanopatterned Culture Plates | Provides topographical cues to induce structural alignment of iPSC-CMs, enhancing contractile function and drug response. | Commercial plates with ridge-groove patterns [21] |
| CRISPR/Cas9 Gene Editing Tools | Create isogenic controls, introduce disease-specific variants, or edit genes to enhance maturity (e.g., overexpress maturity-associated genes). | Various commercial kits and services [9] |
| Surface Marker Antibodies (FACS) | Purify specific CM subpopulations to reduce graft heterogeneity and arrhythmia risk. Anti-SIRPA, anti-CD90, anti-CD200. [18] | Antibodies for SIRPA+CD90-CD200- (non-arrhythmogenic) signature [18] |
| scRNA-seq Platform | Profiling cellular heterogeneity, identifying arrhythmogenic subpopulations, and calculating maturity entropy scores. | 10X Genomics; Entropy analysis R script [19] [18] |
The structural and functional immaturity of iPSC-CMs remains a significant barrier to their application in arrhythmia research and regenerative therapy. Key limitations include depolarized resting potentials, spontaneous automaticity, disorganized sarcomeres, and absent T-tubules, all of which create a proarrhythmic substrate. The protocols and tools detailed in this application note—including transcriptomic maturity scoring, bioengineered alignment, and chronic electrical pacing—provide researchers with standardized methods to quantify and mitigate these challenges. Implementing these strategies will enhance the predictive accuracy of iPSC-CM-based disease models and improve the safety profile of these cells for therapeutic applications, thereby accelerating progress in cardiovascular research and drug development.
Inherited Arrhythmia Syndromes (IAS), such as Long QT syndrome (LQTS), Brugada syndrome (BrS), and Catecholaminergic Polymorphic Ventricular Tachycardia (CPVT), are a group of potentially life-threatening genetic disorders that predispose individuals to ventricular arrhythmias and sudden cardiac death (SCD) [22] [23]. Traditional models for studying these disorders, including heterologous expression systems and animal models, have significant limitations in replicating human-specific cardiac pathophysiology [22] [24]. The advent of human induced pluripotent stem cell-derived cardiomyocytes (iPSC-CMs) has revolutionized this field by providing a patient-specific, human-based platform for disease modeling, drug screening, and safety pharmacology [25] [16] [26]. These cells, generated by reprogramming patient somatic cells, retain the individual's complete genetic background, enabling the faithful recapitulation of complex disease phenotypes in vitro [25] [24]. This application note details standardized protocols and analytical frameworks for leveraging iPSC-CM technology to model LQTS, BrS, and CPVT, thereby advancing both basic research and therapeutic development.
Disease-Specific Phenotypes and Key Findings
iPSC-CMs derived from patients with inherited arrhythmia syndromes successfully replicate the hallmark electrophysiological abnormalities observed in the clinical setting. The table below summarizes the characteristic cellular phenotypes and key experimental findings for each disorder.
Table 1: Disease-specific phenotypes in iPSC-CM models of inherited arrhythmias
| Disorder | Causative Genes | Key Cellular Phenotypes | Representative Experimental Findings |
|---|---|---|---|
| Long QT Syndrome (LQTS) | KCNQ1 (LQT1), KCNH2 (LQT2), SCN5A (LQT3) [22] |
Prolonged action potential duration (APD); Early afterdepolarizations (EADs); Reduced IKs or IKr currents [22] [16] | LQT2 (KCNH2 G1681A): AP prolongation and EADs, with a stronger phenotype in symptomatic vs. asymptomatic carriers [22]. |
| Brugada Syndrome (BrS) | SCN5A, CACNA1C, CACNB2 [22] |
Reduced sodium or calcium current (INa, ICa); Conduction slowing [22] [23] | SCN5A (1795insD): Decreased INa density and larger late sodium current; phenotype can overlap with LQT3 [22]. |
| Catecholaminergic Polymorphic Ventricular Tachycardia (CPVT) | RYR2, CASQ2 [22] |
Diastolic calcium leak; Increased spontaneous calcium sparks; Delayed afterdepolarizations (DADs) under adrenergic stress [22] [16] | RYR2 (F243I, S406L): Increased DADs and calcium sparks with isoproterenol; improvement with dantrolene or flecainide [22]. |
Experimental Protocols for iPSC-CM Arrhythmia Modeling
This section provides detailed methodologies for the key experiments used to characterize arrhythmogenic phenotypes in iPSC-CM models.
Protocol: Directed Differentiation of iPSCs to Cardiomyocytes
This protocol is adapted from robust methods that yield high-purity cardiomyocyte cultures [27].
- Cell Culture and Preconditioning: Maintain human iPSCs in mTeSR Plus medium on Matrigel-coated plates. At approximately 60-80% confluence, precondition cells for 16 hours in RPMI B27 minus insulin medium supplemented with 2 ng/mL BMP4, 1% GlutaMAX, 200 µM L-ascorbic acid, and 1:100 Matrigel [27].
- Mesoderm Induction (Day 0): Initiate differentiation by switching to RPMI B27 minus insulin medium containing 8 ng/mL Activin A and 10 ng/mL BMP4 for 24 hours [27].
- Cardiac Mesoderm Specification (Day 2): Replace the medium with RPMI B27 minus insulin supplemented with 200 µM L-ascorbic acid, 10 µM KY02111 (a Wnt inhibitor), and 10 µM XAV939 (a Wnt inhibitor) for 48 hours [27].
- Metabolic Selection (Day 4): Change to RPMI B27 plus insulin medium, retaining the 200 µM L-ascorbic acid and Wnt inhibitors for an additional 48 hours.
- Maturation (Day 6 Onwards): Continue culturing the cells in RPMI B27 plus insulin medium, changing the medium every 48 hours. Spontaneously beating areas typically appear between days 8-12.
- Cell Dissociation (Days 12-15): To harvest cardiomyocytes for experiments, dissociate the cells using 0.2% collagenase type I for 45 minutes at 37°C, followed by 0.25% Trypsin-EDTA for 10 minutes at 37°C. Neutralize with serum-containing medium, filter through a 70 µm strainer, and plate for functional assays [27].
Protocol: Multi-Electrode Array (MEA) Electrophysiology
MEA is a non-invasive, high-throughput technique for recording extracellular field potentials from iPSC-CM monolayers, ideal for drug screening and arrhythmia detection [16] [28] [29].
- Cell Plating: Plate a high-density suspension of dissociated iPSC-CMs (e.g., 100,000 - 200,000 cells per well) onto Matrigel-coated MEA plates. Allow the cells to form a confluent, synchronously beating monolayer over 3-7 days.
- Equipment Setup: Use a commercially available MEA system (e.g., CardioExcyte 96) according to manufacturer specifications. Maintain recordings at 37°C and 5% CO₂ [28].
- Signal Acquisition: Record extracellular field potentials from all electrodes simultaneously. Key parameters include:
- Beat Period: Interval between successive field potential spikes.
- Field Potential Duration (FPD): Interval from the sodium spike to the peak of the T-wave, analogous to the QT interval on a surface ECG. This is often rate-corrected (cFPD) [28].
- Arrhythmia Detection: Manually or automatically screen for irregular beat patterns (e.g., ectopic beats, tachycardia).
- Drug Testing: Apply the compound of interest at multiple concentrations (e.g., 4 concentrations) and record the effects on electrophysiological parameters. DMSO should be used as a vehicle control.
- Data Analysis: Analyze dynamic changes in beat patterns and FPD. A significant prolongation of the FPD is indicative of a proarrhythmic risk, such as QT prolongation [28].
Protocol: Patch-Clamp Electrophysiology
Patch-clamp is the gold-standard technique for detailed investigation of action potentials and individual ion currents in single iPSC-CMs [22] [24].
- Cell Preparation: Plate dissociated iPSC-CMs at low density on glass coverslips to allow for easy identification and access to single cells.
- Setup Configuration: Use an amplifier, digitizer, and appropriate software. Employ borosilicate glass micropipettes filled with a potassium-based internal solution. The external solution should be Tyrode's solution maintained at 36±1°C.
- Action Potential (AP) Recording: Use the current-clamp mode to record action potentials from spontaneously beating or electrically paced cells. Key parameters to analyze are:
- Resting Membrane Potential (Vm)
- Action Potential Amplitude (APA)
- Action Potential Duration at 90% repolarization (APD90)
- Presence of Afterdepolarizations (EADs or DADs)
- Ion Current Recording: Use the voltage-clamp mode to isolate and record specific ionic currents (e.g., IKr, IKs, INa, ICaL) by applying specific voltage protocols and pharmacological blockers.
Protocol: Calcium Transient Imaging
This protocol assesses intracellular calcium handling, which is critical for modeling diseases like CPVT [22] [30].
- Cell Loading: Load iPSC-CMs with a fluorescent, cell-permeable calcium indicator dye (e.g., Cal-520 AM, Fluo-4 AM) for 20-30 minutes at 37°C.
- Image Acquisition: Use a high-speed confocal or fluorescence microscope equipped with an environmental chamber to maintain 37°C and 5% CO₂. Record fluorescence signals from single cells or monolayers during spontaneous contraction or pacing.
- Pharmacological Challenge: To unmask latent phenotypes like in CPVT, perfuse the cells with β-adrenergic agonists such as isoproterenol (e.g., 100 nM - 1 µM).
- Data Analysis: Analyze the calcium transients for:
- Transient Amplitude
- Decay Tau (τ)
- Frequency of spontaneous calcium sparks (using line-scan mode)
- Incidence of aberrant transients indicative of DADs
Diagram 1: Experimental workflow for iPSC-CM modeling of inherited arrhythmias
The Scientist's Toolkit: Essential Research Reagents and Materials
Successful modeling of inherited arrhythmias requires a suite of reliable reagents and platforms. The following table details key solutions used in the field.
Table 2: Key research reagent solutions for iPSC-based arrhythmia studies
| Item | Function / Application | Example Use-Case |
|---|---|---|
| Yamanaka Factor Reprogramming Kits | Reprogram patient somatic cells (e.g., fibroblasts, PBMCs) to iPSCs. | Generating patient-specific iPSC lines from affected individuals and healthy controls. |
| Defined Cardiomyocyte Differentiation Kits | Directed, efficient differentiation of iPSCs into cardiomyocytes. | Robust generation of ventricular or atrial-like cardiomyocytes using standardized protocols [27]. |
| hiPSC-CM Lines (e.g., YBLiCardio) | Commercially available, well-characterized iPSC-CMs for screening. | High-throughput cardiotoxicity testing within the CiPA (Comprehensive in vitro Proarrhythmia Assay) paradigm [28]. |
| Multi-Electrode Array (MEA) Systems | Non-invasive, high-throughput recording of extracellular field potentials. | Detecting QT prolongation and proarrhythmic events in response to drug compounds [28] [29]. |
| Voltage-/Calcium-Sensitive Dyes | Optical mapping of action potentials and calcium transients. | Visualizing conduction and calcium handling in 2D monolayers or 3D tissues [30]. |
| CRISPR/Cas9 Gene Editing Systems | Create isogenic control lines by correcting patient mutations, or introduce mutations into healthy lines. | Validating pathogenicity of genetic variants and studying direct genotype-phenotype relationships [22]. |
Data Analysis and Integration
Advanced analysis of iPSC-CM data is crucial for accurate phenotyping. The CiPA initiative promotes a paradigm shift from single-parameter assessment (e.g., hERG blockade) to a more integrated approach [28]. This involves combining data from multiple ion channel assays, in silico modeling of human ventricular action potentials, and confirmation in iPSC-CMs to comprehensively evaluate proarrhythmic risk. Furthermore, the integration of multi-omics data (transcriptomics, proteomics) with electrophysiological readouts can provide deeper insights into disease mechanisms. Artificial intelligence (AI) is also being leveraged to enhance the predictive power of these models for risk stratification and therapy personalization [25] [23].
Diagram 2: Simplified signaling and arrhythmia triggers in inherited syndromes
iPSC-derived cardiomyocytes provide an unprecedented and powerful platform for modeling the complex pathophysiology of inherited arrhythmia syndromes. The protocols and frameworks outlined in this document provide researchers with a standardized approach to generate robust, patient-specific data on disease mechanisms, drug responses, and therapeutic safety. As maturation and bioengineering techniques continue to advance, these human-based models are poised to play an increasingly central role in de-risking drug discovery, personalizing patient therapy, and ultimately achieving the goal of durable phenotype correction through novel genomic and precision ablation therapies [25] [23].
Patient-specific induced pluripotent stem cell-derived cardiomyocytes (iPSC-CMs) have emerged as a transformative platform for modeling inherited cardiac arrhythmias and personalizing therapeutic strategies [31] [9]. By reprogramming a patient's somatic cells (e.g., from skin or blood) into pluripotent stem cells and subsequently differentiating them into cardiomyocytes, researchers can generate an unlimited supply of human cardiomyocytes that carry the patient's exact genetic background [32]. This approach bypasses the ethical concerns of embryonic stem cells and the limited translatability of animal models, providing a pivotal tool for elucidating disease mechanisms, reclassifying variants of uncertain significance, and performing patient-specific drug screening [1] [9]. This Application Note details the core methodologies and experimental protocols for leveraging this technology in arrhythmia research.
Experimental Protocols
Generation and Differentiation of Patient-Specific iPSCs
Protocol: Reprogramming of Somatic Cells to iPSCs
- Cell Source Selection: Obtain patient somatic cells via minimally invasive procedures. Common sources include:
- Reprogramming Factor Delivery: Introduce the Yamanaka factors (OCT3/4, SOX2, c-MYC, KLF4) using a non-integrating method to ensure clinical safety and minimize genomic alterations [31] [32].
- Recommended Method: Use the Sendai virus or episomal vectors for high-efficiency, integration-free reprogramming [31].
- Culture Conditions: Maintain cells on feeder layers (e.g., mouse embryonic fibroblasts) or in feeder-free systems using extracellular matrices like Matrigel or vitronectin. Use serum-free media such as Essential 8 or mTeSR1 to maintain pluripotency [32].
- Validation: Confirm successful reprogramming by assessing pluripotency marker expression (e.g., via immunostaining for NANOG, SSEA-4) and functional capacity for teratoma formation [32].
Protocol: Directed Differentiation of iPSCs to Cardiomyocytes (iPSC-CMs) This protocol leverages WNT signaling pathway modulation for efficient cardiogenesis [31].
- Mesendoderm Induction: On day 0, dissociate iPSCs into single cells and seed them as a monolayer. Initiate differentiation by adding a high concentration of the GSK3β inhibitor CHIR99021 (e.g., 6-12 µM) in RPMI/B27-insulin media to activate WNT/β-catenin signaling [31].
- Cardiac Progenitor Specification: After 24-48 hours, replace the medium with fresh RPMI/B27-insulin media containing a WNT inhibitor (e.g., IWR-1 at 5 µM) to direct cells toward the cardiac lineage [31].
- Metabolic Selection and Maturation: From approximately day 7 onwards, replace the media with glucose-free RPMI/B27-supplemented lactate media for 5-7 days. This selectively eliminates non-cardiomyocytes, which cannot utilize lactate as an energy source, resulting in a highly pure (>95%) population of iPSC-CMs [31] [7]. Subsequently, culture cells in standard RPMI/B27-complete media for further maturation.
Advanced Maturation of iPSC-CMs
A critical limitation of iPSC-CMs is their fetal-like immaturity. The following combined protocol, which integrates multiple physiological cues, significantly enhances structural, metabolic, and electrophysiological maturity to better model adult cardiomyocytes [7].
Protocol: Combined Maturation for iPSC-CMs
- Materials:
- Lipid-Enriched Maturation Medium (MM): RPMI 1640 supplemented with B-27, 1% L-ascorbic acid, 1% penicillin-streptomycin, and a lipid mixture (e.g., 100 µM palmitic acid and 100 µM oleic acid conjugated to BSA). Increase calcium concentration to 2.4 mM [7].
- Nanopatterned (NP) Surfaces: Culture surfaces with micro- or nanopatterned lines of extracellular matrix (e.g., fibronectin) to guide cellular alignment. A line width of 10-20 µm and spacing of 5-10 µm is effective [7].
- Electrostimulation (ES) Equipment: A carbon electrode or similar system capable of delivering a 2 Hz, 5 V/cm rectangular pulse train [7].
- Procedure:
- On differentiation day 15, dissociate iPSC-CMs and seed them at a high density (~1.5 million cells/cm²) onto the nanopatterned surfaces.
- Culture the cells in the lipid-enriched, high-calcium MM.
- After 48-72 hours, initiate continuous electrostimulation at 2 Hz for a minimum of 2 weeks, refreshing the MM every 2-3 days.
- Validate maturation success by assessing sarcomere structure, mitochondrial function, and electrophysiological parameters (see Section 3.1).
The synergistic effect of this combined approach on the maturation process is illustrated below.
Diagram 1: Combined Maturation Workflow for iPSC-CMs. This diagram illustrates how the integration of metabolic conditioning (MM), structural guidance (NP), and physiological pacing (ES) drives synergistic improvements in key maturation domains. ES is a key driver across all three domains [7].
Functional Phenotyping and Drug Testing
Protocol: Contractility Analysis via CONTRAX Pipeline The CONTRAX pipeline enables high-throughput, quantitative tracking of single iPSC-CM contractile dynamics [33].
- Cell Locator Module: Plate single iPSC-CMs on hydrogels with tunable stiffness (e.g., 10 kPa for healthy myocardium, 35 kPa for fibrotic conditions). Acquire a low-magnification (10x) survey image. Use the software to automatically identify and create a position list of single cells based on user-defined criteria (e.g., cell area, elongation) [33].
- Automated TFM Acquisition: The system automatically moves the microscope stage to each cell location and acquires high-speed video recordings (≥150 fps) for 5-10 seconds at 40x magnification [33].
- Streamlined Traction Force Microscopy (TFM) Analysis:
- Use Digital Image Correlation (DIC) to track the displacement of fluorescent fiducial markers embedded in the hydrogel.
- Apply Fourier Transform Traction Cytometry (FTTC) to back-calculate the traction stress from the substrate deformation.
- The software automatically outputs key contractile parameters, including maximum contractile force (Fmax), contraction velocity (vcontr), relaxation velocity (vrel), and work (Wmax) [33].
- Drug Testing: Acquire baseline TFM videos. Treat cells with the drug of interest (e.g., 100-500 nM Mavacamten for HCM studies) for one hour. Re-acquire TFM videos from the same cells to assess drug response [33].
Protocol: Electrophysiological Profiling
- Multi-Electrode Array (MEA): Record field potentials from iPSC-CM monolayers to assess parameters like field potential duration (FPD, a surrogate for QT interval), beating rate, and beat irregularity. This is ideal for high-throughput safety pharmacology [34].
- Patch Clamp Electrophysiology: Use this gold-standard technique to record action potentials and specific ion currents (e.g., IKr, INa, I_Ca) from single iPSC-CMs, providing detailed mechanistic insights into channelopathies [7] [34].
Data Presentation and Analysis
Quantitative Maturation Metrics
The efficacy of the combined maturation protocol is demonstrated by quantitative improvements in electrophysiological and structural parameters, as summarized in the table below.
Table 1: Quantitative Metrics of iPSC-CM Maturation After Combined Protocol Application (Adapted from [7])
| Parameter | B27 Control | MM Only | MM + NP | MM + NP + ES | Measurement Technique |
|---|---|---|---|---|---|
| Resting Membrane Potential (mV) | -44.1 ± 9.8 | -49.7 ± 8.5 | -58.2 ± 7.4 | -65.6 ± 8.5 | Patch Clamp |
| AP Upstroke Velocity, Vmax (V/s) | 4.2 ± 1.4 | 5.0 ± 1.1 | 6.6 ± 2.5 | 11.0 ± 7.4 | Patch Clamp |
| Conduction Velocity (cm/s) | 12.5 ± 5.8 | 22.3 ± 3.7 | 25.6 ± 4.3 | 27.8 ± 7.3 | Multi-Electrode Array |
| Cells with "Notch-and-Dome" AP (%) | 0% | 0% | 0% | ~43% | Patch Clamp |
| Transient Outward K+ Current (Ito) Density | Baseline | Increased | Similar to MM | Highest Increase | Patch Clamp |
| Sarcomere Organization | Disorganized | Disorganized | Highly Organized | Highly Organized | Immunostaining (α-actinin) |
Modeling Arrhythmogenic Diseases
Patient-specific iPSC-CMs have been successfully used to model a wide spectrum of inherited arrhythmogenic diseases, enabling mechanistic studies and drug discovery.
Table 2: Patient-Specific iPSC-CM Models of Inherited Arrhythmia Syndromes
| Disease Model | Genetic / Pathogenic Mechanism | Key Phenotype in iPSC-CMs | Potential Therapeutic Insights |
|---|---|---|---|
| Long QT Syndrome (LQTS) [31] | Mutations in KCNQ1 (LQT1), KCNH2 (LQT2), SCN5A (LQT3) | Prolonged action potential duration, early afterdepolarizations, arrhythmogenic triggers [31] [34] | Attenuation of phenotype with beta-blockers (LQT1) or sodium channel blockers (LQT3) [31] |
| Catecholaminergic Polymorphic Ventricular Tachycardia (CPVT) [31] [34] | Mutations in RYR2 or CASQ2 | Abnormal calcium transients, delayed afterdepolarizations (DADs) under adrenergic stimulation [34] | Flecainide shown to restore calcium stability [34] |
| Brugada Syndrome (BrS) [31] [9] | SCN5A loss-of-function mutations | Slowed conduction, conduction block, ST-segment elevation in engineered tissues [31] [9] | Sodium current enhancers can normalize upstroke velocity [34] |
| Atrial Fibrillation (AF) [35] | Mutations in non-ion channel genes (e.g., NPPA) | Ion channel remodeling (e.g., enhanced potassium current), mitochondrial dysfunction [35] | Unmasks electro-metabolic mechanism for AF substrate [35] |
| Dilated Cardiomyopathy (DCM) [31] [33] | Mutations in Titin (TTN), Troponin T (TNNT2), Dystrophin (DMD) | Deficiencies in sarcomere function, reduced contractile force, abnormal stress response [31] [33] | Mavacamten reduces contractile force in HCM models; potential for personalized dosing [33] |
The overall workflow for creating and utilizing these patient-specific disease models is outlined below.
Diagram 2: iPSC-CM Arrhythmia Modeling Workflow. This end-to-end pipeline shows the process from patient cell acquisition to the generation of a mature, phenotyped disease model for therapeutic development.
The Scientist's Toolkit: Essential Research Reagents and Materials
Table 3: Key Reagents and Materials for iPSC-CM Arrhythmia Research
| Item | Function / Application | Examples / Specifications |
|---|---|---|
| Reprogramming Kit (Non-integrating) | Generation of footprint-free iPSCs from somatic cells. | Sendai virus reprogramming kit (CytoTune); Episomal plasmid kits [31] [32]. |
| Cardiac Differentiation Kit | Directed differentiation of iPSCs to cardiomyocytes. | Commercially available kits based on WNT modulation; GSK3β inhibitor (CHIR99021) & WNT inhibitor (IWR-1) [31]. |
| Maturation Medium Supplements | Enhanced metabolic and electrophysiological maturation. | B-27 Supplement; Fatty acids (palmitic/oleic acid); Ascorbic acid [7]. |
| Nanopatterned Culture Surfaces | Structural alignment and sarcomere organization. | CYTOOchips or microcontact-printed surfaces with fibronectin lines (10-20 µm width) [7]. |
| Electrostimulation Chamber | Application of physiological pacing for maturation. | C-Pace EP Culture Pacer or similar system for delivering 2Hz electrical stimulation [7]. |
| Traction Force Microscopy Substrate | Quantification of single-cell contractile force. | Polyacrylamide hydrogels with tunable stiffness (e.g., 10-35 kPa) and embedded fluorescent beads [33]. |
| Multi-Electrode Array (MEA) System | Non-invasive, high-throughput electrophysiological recording. | Systems from Multi Channel Systems MCS GmbH or Axion BioSystems for field potential recording [34]. |
| Ion Channel Modulators | Pharmacological validation of specific ion currents. | E-4031 (IKr blocker); Nifedipine (ICa blocker); Tetrodotoxin (INa blocker). |
The protocols and data outlined in this Application Note establish a robust framework for utilizing patient-specific iPSC-CMs in personalized arrhythmia research. The implementation of advanced maturation techniques is critical for generating physiologically relevant models that faithfully recapitulate adult disease phenotypes. By integrating these methodologies with high-throughput functional phenotyping platforms like CONTRAX and MEA, researchers can effectively deconvolute complex disease mechanisms, reclassify pathogenic variants, and stratify patients for targeted therapies, thereby accelerating the development of personalized anti-arrhythmic treatments.
Advanced Applications in Arrhythmia Research and Drug Development
Heart-on-a-Chip Systems for Arrhythmia Mechanism Investigation
Heart-on-a-Chip (HoC) technology has emerged as a transformative platform for creating biomimetic in vitro models of human cardiac tissue. These microfluidic devices recapitulate the microscale anatomy, physiology, and biomechanics of the heart, providing a more clinically relevant alternative to traditional 2D cell cultures and animal models for cardiovascular research [36]. Within the context of arrhythmia studies, HoC systems integrated with human induced pluripotent stem cell-derived cardiomyocytes (iPSC-CMs) enable patient-specific investigation of disease mechanisms, drug responses, and genetic variants in a controlled, human-relevant environment [37] [1]. This Application Note provides detailed protocols and methodologies for leveraging HoC technology specifically for arrhythmia mechanism investigation, with a focus on practical implementation for researchers and drug development professionals.
Key Research Reagent Solutions
The successful implementation of HoC systems for arrhythmia research requires carefully selected materials and reagents. The table below summarizes essential components and their specific functions in developing physiologically relevant cardiac models.
Table 1: Essential Research Reagents for Heart-on-a-Chip Development
| Reagent Category | Specific Examples | Function in HoC Systems |
|---|---|---|
| Chip Materials | Polydimethylsiloxane (PDMS), Poly(methyl methacrylate) (PMMA) | Fabricate microfluidic chambers and channels; provide optical transparency, gas permeability, and structural support [36]. |
| 3D Scaffold Materials | Polycaprolactone (PCL), Polylactic acid (PLA), Collagen-I, Gelatin methacrylate (GelMA) | Create three-dimensional extracellular matrix (ECM)-mimetic environments for cardiomyocyte culture and tissue maturation [36]. |
| Conductive Additives | Gold nanorods (GNRs), Carbon nanotubes, Conductive polymers | Enhance electrical signal propagation within engineered cardiac tissues; improve synchronous contraction and calcium handling [38]. |
| Cell Sources | iPSC-derived cardiomyocytes (iPSC-CMs), iPSC-derived cardiac fibroblasts (hiCFs) | Provide patient-specific or disease-specific human cells for modeling arrhythmias; enable isogenic co-culture systems [38]. |
| Surface Modification | Collagen-I, Fibronectin | Treat chip surfaces to promote cardiomyocyte adhesion, spreading, and maturation [36]. |
| Hydrogel Matrix | Collagen-I/Matrigel cocktail | Embed cardiac cells to form 3D tissues with native-like architecture and composition [38]. |
Experimental Protocols for Arrhythmia Modeling
Protocol: Fabrication of an Electroconductive Heart-on-a-Chip (eHOC)
This protocol details the construction of a 3D electroconductive HoC model to enhance tissue maturation and functionality for robust arrhythmia studies [38].
Materials:
- SU-8 photoresist and silicon wafer
- PDMS base and crosslinker (10:1 ratio)
- Methyltrichlorosilane (MTCS)
- Gold nanorods (GNRs, ~42 nm length, ~11 nm diameter)
- Collagen-I solution, Matrigel
- Isogenic iPSC-CMs and hiCFs
- Oxygen plasma system
Methodology:
- Master Mold Fabrication: Create a master silicon wafer using photolithography. The design should feature a central tissue region with staggered elliptical microposts (150μm spacing) to induce cellular alignment, flanked by media channels separated by trapezoidal microposts (100μm spacing) [38].
- PDMS Chip Casting: Treat the master mold with MTCS to reduce PDMS adhesion. Pour a degassed mixture of PDMS base and crosslinker (10:1 ratio) onto the master and cure at 80°C for 2 hours. Peel off the cured PDMS and create inlet/outlet ports (1-1.5 mm diameter) for media channels and tissue loading [38].
- Electroconductive Hydrogel Preparation: Synthesize an electroconductive hydrogel by incorporating GNRs at an optimized concentration (e.g., 0.5-1.0 mg/mL) into a pre-mixed Col-I/Matrigel hydrogel matrix. Keep the hydrogel on ice until use to prevent premature polymerization [38].
- Cell-Hydrogel Mixture Preparation: Co-culture isogenic hiPSC-CMs and hiCFs at a specific ratio (e.g., 3:1). Resuspend the cell mixture in the electroconductive hydrogel solution at a final density of 50-100 million cells/mL [38].
- Chip Seeding and Culture: Load the cell-laden hydrogel into the central tissue region of the PDMS chip. Allow gelation to occur (37°C, 30 minutes), then connect the media channels to a continuous flow system providing culture medium. Culture the constructs for 2-4 weeks to allow for tissue maturation and functionality development [38].
Protocol: Functional Characterization of Arrhythmogenic Phenotypes
Comprehensive functional analysis is critical for validating HoC models and investigating arrhythmia mechanisms. The table below outlines key parameters and methods for assessment.
Table 2: Quantitative Functional Analysis of Cardiac Tissues in HoC
| Parameter | Measurement Technique | Application in Arrhythmia Studies | Sample Data from eHOC [38] |
|---|---|---|---|
| Contractility | Video microscopy with motion analysis software | Quantify beating frequency, rate, amplitude, and synchronization; detect irregular rhythms or arrested contraction. | +40-50% increase in contractile amplitude in eHOC vs. non-conductive controls. |
| Calcium Handling | Genetically encoded or chemical Ca²⁺ indicators (e.g., Fluo-4) | Assess Ca²⁺ transient kinetics, wave propagation, and the presence of spontaneous or erratic activity. | +30% improvement in calcium transient amplitude in eHOC. |
| Electrophysiology | Microelectrode arrays (MEAs), patch-clamp | Measure field potential, action potential duration, and conduction velocity to identify conduction abnormalities. | N/A in source, but highly recommended for arrhythmia models. |
| Gene Expression | qRT-PCR, scRNA-seq | Evaluate maturation markers (e.g., TNNT2, MYH6), ion channels (e.g., SCN5A), and gap junctions (e.g., GJA1). | Upregulation of GJA1 (Connexin 43), TNNI3, and ACTN2 in eHOC. |
Procedure for Contractility and Calcium Transient Analysis:
- Image Acquisition: Place the HoC system on a temperature-controlled stage of an inverted microscope. Acquire high-speed bright-field videos (100+ fps) for contractility analysis. For calcium imaging, load tissues with a fluorescent dye (e.g., Fluo-4 AM) and record fluorescence videos [38].
- Motion Analysis: Use specialized software (e.g., MUSCLEMOTION, SOFA) to analyze pixel intensity changes or cell displacement over time to generate contractility traces. Derive parameters like beating frequency, contraction/relaxation velocity, and amplitude.
- Calcium Transient Analysis: Analyze fluorescence intensity changes over time to plot calcium transients. Key parameters include transient duration (FDHM), time to peak, and decay constant (tau), which reflect the integrity of calcium-induced calcium release and reuptake.
- Arrhythmia Induction (Optional): To probe specific arrhythmic susceptibilities, perfuse the system with proarrhythmic compounds (e.g., IKr blockers like E-4031, isoproterenol) or manipulate ion concentrations (e.g., low K⁺). Monitor for the onset of early afterdepolarizations (EADs), delayed afterdepolarizations (DADs), or tachyarrhythmia.
Visualization of Workflows and Signaling
Experimental Workflow for Arrhythmia Investigation
The following diagram illustrates the integrated process of creating a patient-specific HoC model for arrhythmia studies, from cell sourcing to functional analysis.
Signaling Pathways in Enhanced Cardiac Maturation
The incorporation of electroconductive materials in HoC systems influences key signaling pathways that promote tissue maturation, a critical factor for accurate arrhythmia modeling. This diagram outlines the proposed mechanism.
Heart-on-a-Chip systems represent a powerful and evolving technology for investigating the complex mechanisms underlying cardiac arrhythmias. The protocols and application notes detailed herein provide a framework for constructing physiologically relevant models using patient-specific iPSC-CMs, conductive biomaterials, and comprehensive functional assessment. By enabling the recapitulation of key arrhythmogenic features—such as disrupted electrical conduction, aberrant calcium handling, and contractile dysfunction—these advanced in vitro platforms accelerate pathomechanistic discovery and therapeutic development for inherited and acquired arrhythmia syndromes.
High-Throughput Drug Screening and Cardiotoxicity Assessment Using iPSC-CMs
Cardiovascular disease remains a leading cause of global mortality, with cardiotoxicity representing a significant cause of failure in drug development pipelines [26]. Approximately one-third of regulatory clearances are abandoned due to cardiovascular safety concerns, underscoring the critical need for predictive preclinical models [39]. Traditional models, including animal studies and heterologous cell systems, face substantial limitations due to species-specific differences and inability to fully recapitulate human cardiac electrophysiology [9] [26].
Human induced pluripotent stem cell-derived cardiomyocytes (iPSC-CMs) have emerged as a transformative platform for cardiotoxicity assessment and drug discovery. These cells provide a patient-specific human cardiomyocyte model that reflects native electrophysiological characteristics while overcoming ethical concerns and limited availability associated with primary cardiomyocytes [40] [9] [15]. The Comprehensive in vitro Proarrhythmia Assay (CiPA) initiative has pioneered the use of iPSC-CMs for systematic evaluation of drug-induced proarrhythmic potential, establishing a new paradigm for cardiac safety pharmacology [41] [39].
This application note provides detailed methodologies for implementing high-throughput drug screening and cardiotoxicity assessment using iPSC-CMs, with particular emphasis on torsadogenic risk stratification and multi-parametric phenotypic analysis.
Key Research Reagent Solutions
Table 1: Essential research reagents and platforms for iPSC-CM cardiotoxicity screening
| Reagent/Platform | Function/Application | Key Features |
|---|---|---|
| iPSC-Derived Ventricular Cardiomyocytes (e.g., axoCells, iCell Cardiomyocytes) | Primary cellular model for cardiotoxicity screening | Expression of multiple key cardiac ion channels; demonstrated predictable pharmacological response to CiPA compounds [39] |
| Microelectrode Array (MEA) Systems | Non-invasive electrophysiological recording | Measures field potential duration (FPD), beating frequency, and detects arrhythmic events [41] |
| Voltage-Sensitive Dyes & CellOPTIQ Platform | Optical measurement of action potentials | High-content screening of action potential duration (APD) and waveform morphology [39] |
| FLIPR Penta System with EarlyTox Cardiotoxicity Kit | High-throughput calcium flux assays | High-speed calcium imaging (up to 100 fps); detects alterations in Ca²⁺ transient kinetics [42] |
| Dual-Cardiotoxicity Evaluation Method | Simultaneous assessment of electrophysiology and contractility | MEA-based approach correlating field potential with contractile force [41] |
Experimental Design and Workflows
CiPA Initiative and Compound Classification
The Comprehensive in vitro Proarrhythmia Assay (CiPA) framework classifies compounds into three tiers of torsadogenic (TdP) risk: high, intermediate, and low/no risk. This classification is based on a combination of in silico modeling, patch-clamp data on specific ion channels, and functional assays using iPSC-CMs [41] [39]. The initiative has established a standardized panel of 28 reference compounds with known clinical TdP risk for validation of iPSC-CM models [39] [42].
Table 2: Representative CiPA compounds and their torsadogenic risk classification
| TdP Risk Category | Representative Compounds |
|---|---|
| High Risk | Bepridil, Dofetilide, Quinidine, Sotalol, Azimilide, Ibutilide [39] |
| Intermediate Risk | Chlorpromazine, Cisapride, Terfenadine, Ondansetron, Astemizole, Clarithromycin, Clozapine [39] |
| Low/No Risk | Diltiazem, Mexiletine, Ranolazine, Verapamil, Loratadine, Metoprolol, Nifedipine [39] |
Microelectrode Array (MEA) Workflow for Dual-Cardiotoxicity Assessment
The dual-cardiotoxicity evaluation method simultaneously assesses electrophysiological signals and contractile force in iPSC-CMs, providing complementary insights beyond traditional field potential duration (FPD) analysis alone [41].
MEA Experimental Protocol
Cell Culture and Preparation:
- Thaw cryopreserved human iPSC-derived ventricular cardiomyocytes (e.g., axoCells or iCell Cardiomyocytes) according to manufacturer specifications.
- Plate cells at a density of 60,000 cells per well onto CardioExcyte96 sensor plates pre-coated with Matrigel (50 μL of 1:100 dilution) [43].
- Maintain cells in specialized cardiomyocyte maintenance media for 6-7 days, with media changes every 48 hours, until synchronous contractions are visually confirmed [41] [39].
Compound Exposure and Recording:
- Prepare serial dilutions of test compounds in maintenance media, ensuring final DMSO concentration does not exceed 0.1% (v/v).
- Apply compounds to iPSC-CMs and incubate for 30 minutes at 37°C, 5% CO₂ prior to recording.
- Record extracellular field potentials and contractile signals simultaneously using MEA system for 2-3 minutes per well.
- Include positive (e.g., Dofetilide 3 nM) and vehicle (0.1% DMSO) controls in each experimental run [39].
Data Analysis:
- Calculate corrected FPD (FPDc) using Fridericia's formula: FPDc = FPD / RR⁰·³³, where RR is the interval between successive beats.
- Analyze contractile parameters including amplitude, duration, and rise/fall kinetics.
- Identify arrhythmic events including early after-depolarizations (EADs), irregular beating patterns, and quiescence.
- Apply quality control criteria: exclude traces with poor signal-to-noise ratio or inconsistent beating frequency [41] [43].
Calcium Flux Assay Workflow for High-Throughput Screening
Calcium flux assays provide a high-throughput complementary approach to MEA for detecting drug-induced alterations in calcium handling, a key mechanism in arrhythmogenesis [42].
Calcium Flux Experimental Protocol
Cell Preparation and Dye Loading:
- Plate cryopreserved human iPSC-derived cardiomyocytes at 20,000 cells/well (96-well format) or 10,000 cells/well (384-well format) using maintenance media.
- Culture for 7 days with media changes every 48 hours until robust, synchronous contractions are observed.
- Load cells with EarlyTox Calcium-sensitive dye for 2 hours at 37°C, 5% CO₂ according to manufacturer protocol [42].
Compound Treatment and Kinetic Imaging:
- Prepare test compounds at 4 different concentrations in maintenance media, with n=6 replicates per concentration.
- Treat cells with compounds for 30 minutes at 37°C, 5% CO₂.
- Acquire kinetic images using FLIPR Penta High-Throughput Cellular Screening System with high-speed EMCCD camera capturing 30-50 frames per second for 1-2 minutes per well.
- For endpoint cytotoxicity assessment, treat separate plates for 24 hours, then stain with Calcein AM (1 μM), MitoTracker Orange (0.2 μM), and Hoechst nuclear dye (2 μM) for 2 hours [42].
Data Analysis with ScreenWorks Peak Pro 2:
- Analyze calcium oscillation traces using >20 waveform descriptors in ScreenWorks Peak Pro 2 software.
- Calculate key parameters: beating frequency (peaks/minute), peak amplitude, peak width at 90% height (CTD90), rise time (20% to 80% peak height), and decay time (80% to 20% peak height).
- Identify abnormal patterns: EAD-like events, peak prolongation, oscillation irregularity, and fibrillation.
- Determine EC₅₀ values for each parameter and classify compounds based on multi-parametric response profiles [42].
Data Analysis and Interpretation
Multi-Parametric Cardiotoxicity Assessment
The power of iPSC-CM-based screening lies in multi-parametric assessment that captures the complex interplay of ion channel effects. Different TdP risk categories produce distinct phenotypic signatures:
High TdP Risk Compounds: (e.g., Dofetilide, Azimilide)
- Prolong field potential duration (FPDc) and action potential duration (APD₉₀)
- Induce early after-depolarizations (EADs) and arrhythmic events
- Cause concentration-dependent triangulation of action potential morphology
- May lead to quiescence at high concentrations [41] [39]
Low/No TdP Risk Compounds: (e.g., Verapamil, Ranolazine)
- May show hERG blockade at low concentrations but compensate through multi-channel effects
- Typically decrease FPDc at higher concentrations
- Show significant reduction in contractility compared to high-risk compounds
- Exhibit balanced ion channel inhibition without proarrhythmic triggers [41] [39]
Table 3: Representative multi-parametric responses for CiPA compounds in iPSC-CMs
| Compound | TdP Risk | FPDc/APD₉₀ Effect | Arrhythmic Events | Contractility Effect | Key Multi-Channel Interactions |
|---|---|---|---|---|---|
| Dofetilide | High | Prolongation | EADs, Quiescence | Mild reduction | Pure hERG blockade |
| Quinidine | High | Prolongation | EADs, Irregularity | Moderate reduction | hERG + late Na⁺ block |
| Verapamil | Low | Shortening | None | Significant reduction | hERG + Ca²⁺ channel block |
| Ranolazine | Low | Mild prolongation | None | Moderate reduction | hERG + late Na⁺ block |
| Nifedipine | Low | Shortening | None | Significant reduction | Primary Ca²⁺ channel block |
Stratified Risk Assessment and Decision Making
The integrated analysis of electrophysiological and functional parameters enables robust cardiotoxicity risk stratification:
- High Risk Signature: FPDc prolongation >15% + arrhythmic events + moderate contractility effects
- Intermediate Risk Signature: Variable FPDc effects + occasional arrhythmic events + variable contractility effects
- Low Risk Signature: FPDc shortening or minimal change + no arrhythmic events + pronounced contractility reduction
This multi-parametric approach significantly enhances predictive reliability over single-parameter assays such as traditional hERG screening [41] [39].
Technical Considerations and Limitations
iPSC-CM Immaturity and Functional Relevance
A recognized limitation of current iPSC-CM models is their relatively immature phenotype compared to adult human cardiomyocytes. Immature characteristics include:
- Fetal-like gene expression patterns (e.g., α-MHC vs. β-MHC predominance)
- Disorganized sarcomere structure and reduced contractile force
- Absence of developed T-tubules leading to altered calcium handling
- Spontaneous automaticity rather than quiescent state
- Predominantly glycolytic metabolism rather than oxidative phosphorylation [15] [26]
Maturation Strategies for Enhanced Predictive Power
Several strategies can improve iPSC-CM maturity and enhance assay predictive power:
Long-Term Culture: Extending culture duration to 90-120 days promotes structural and functional maturation.
Environmental Cues: Implementing electrical stimulation, mechanical loading, and 3D tissue engineering approaches drives maturation through physiological conditioning [15].
Metabolic Manipulation: Switching to fatty acid-enriched media promotes metabolic maturation from glycolysis to oxidative phosphorylation.
3D Culture Systems: Engineered cardiac tissues and heart-on-a-chip platforms provide more physiological microenvironmental cues [40] [15].
iPSC-CM-based platforms have established themselves as indispensable tools for high-throughput cardiotoxicity screening and drug development. The multi-parametric approaches outlined in this application note – particularly the dual-cardiotoxicity assessment combining electrophysiology and contractility – provide comprehensive evaluation beyond traditional single-parameter assays.
The ongoing development of more mature iPSC-CM models, combined with advanced bioengineering approaches such as heart-on-a-chip systems and high-content imaging, will further enhance the predictive power of these platforms. Additionally, patient-specific iPSC-CMs offer exciting opportunities for personalized cardiotoxicity risk assessment and precision medicine approaches in cardiovascular pharmacology.
As these technologies continue to evolve, iPSC-CM-based screening is poised to become increasingly central to drug development pipelines, enabling more accurate prediction of clinical cardiotoxicity and reducing late-stage drug attrition due to cardiovascular safety concerns.
Multi-Electrode Array (MEA) Systems for Electrophysiological Phenotyping
Multi-Electrode Array (MEA) systems have emerged as a critical platform for non-invasive, long-term, and high-throughput electrophysiological phenotyping of human induced pluripotent stem cell-derived cardiomyocytes (hiPSC-CMs). Within the context of arrhythmia studies, MEA technology enables researchers to quantitatively assess key parameters of cardiac electrophysiology—including field potential duration (FPD), beat rate, and conduction velocity—in a physiologically relevant context. This application note details standardized protocols for the culture, differentiation, and MEA-based analysis of hiPSC-CMs, providing a robust framework for investigating inherited arrhythmogenic diseases and screening for drug-induced proarrhythmia [44] [45] [46].
Experimental Workflow for hiPSC-CM Preparation and MEA Analysis
The following diagram illustrates the comprehensive workflow for generating atrial-specific hiPSC-CMs and conducting MEA recordings for arrhythmia studies.
Key Research Reagent Solutions
The following table catalogs essential reagents and materials required for successful differentiation of hiPSC-CMs and subsequent MEA electrophysiological analysis.
Table 1: Essential Research Reagents for hiPSC-CM Differentiation and MEA Analysis
| Reagent/Material | Function/Application | Example Specifications |
|---|---|---|
| Retinoic Acid (RA) | Directs cardiac progenitors toward an atrial-like lineage [44] | 1 µM in DMSO; added at day 1 and day 2 of differentiation [44] |
| CHIR99021 | GSK-3β inhibitor; activates Wnt signaling to initiate mesoderm formation [45] | 6-8 µM in CDM medium on day 0 of differentiation [45] |
| Wnt-C59 | Wnt signaling inhibitor; promotes cardiac mesoderm specification [45] | 2 µM in CDM medium from day 2 [45] |
| B27 Supplement | Serum-free culture supplement for neuronal and cardiac cells | Used with insulin (maintenance) and without insulin (differentiation) [44] |
| Y-27632 (ROCKi) | ROCK inhibitor; enhances cell survival after passaging and thawing [44] [45] | 10 µM; added 24h after cell seeding [45] |
| Matrigel | Basement membrane matrix for hiPSC attachment and growth | hESC-qualified; used for coating culture vessels [44] [45] |
| Collagenase Type I | Enzyme for cardiomyocyte dissociation prior to MEA plating [44] | 0.2% in PBS with 20% FBS for 45 min at 37°C [44] |
| Multi-Electrode Array Plates | Non-invasive substrate for recording extracellular field potentials | Commercially available (e.g., MCS MEA2100 system) [47] [46] |
Quantitative Electrophysiological Parameters
MEA systems extract several quantitative parameters from the field potential waveform, which serve as key biomarkers for assessing cardiomyocyte health and identifying arrhythmic phenotypes. The typical waveform and its parameters are illustrated below.
The following table summarizes typical baseline values and drug-induced changes for key parameters in hiPSC-CM models, illustrating the utility of MEA for cardiotoxicity screening and disease modeling.
Table 2: Quantitative MEA Parameters in hiPSC-CMs for Arrhythmia Studies
| Parameter / Condition | Typical Baseline Value | Experimental / Pathological Change | Biological & Clinical Significance |
|---|---|---|---|
| Corrected FPD (FPDc) | Varies by cell line and culture conditions [46] | E4031 (hERG blocker): Concentration-dependent prolongation [45] [46] | Surrogate for QT interval; prolonged FPDc indicates increased proarrhythmic risk (e.g., TdP) [45] [46] |
| Beat Rate (BR) | Varies by cell line and culture conditions [46] | Carbamylcholine: Slows beat rate in atrial-like, but not ventricular-like CMs [44] | Indicator of automaticity; used to validate atrial-specific phenotype [44] |
| Arrhythmia Incidence | 0% in healthy, synchronized monolayers [44] | Burst Pacing: Induces rotor-style arrhythmias in atrial syncytia [44] | Demonstrates ability to model re-entrant arrhythmias in vitro [44] |
| Conduction Velocity | >40 cm/s in robust atrial monolayers [44] | Not typically reported in drug studies | Measure of functional syncytium and electrical coupling [44] |
Data Acquisition, Visualization, and Advanced Analysis
The following diagram outlines the process from raw data acquisition to advanced analysis, including the integration of machine learning for deep phenotyping.
Data Handling and Visualization Protocol
- File Format Conversion: Convert raw data files from the acquisition system (e.g., MCS MEA2100) into Hierarchical Data Format version 5 (HDF5) for efficient handling [47] [48].
- Spike Timestamp Export: Export spike detection and sorting results into a Comma-Separated Value (CSV) file for compatibility with visualization tools [47].
- Visualization with MEA Viewer: Utilize the open-source MEA Viewer application for high-performance visualization [47] [48].
- Grid View: Scan analog data from all electrodes simultaneously, allowing for panning and zooming through the time record.
- Signal Comparison View: Overlay extracellular voltage data with spike timestamp data to validate detection and sorting accuracy.
- Raster Plot: Display array-wide activity patterns across the entire recording duration interactively [48].
Machine Learning-Enhanced Analysis
For advanced arrhythmia classification, machine learning (ML) models can be trained on features extracted from electrophysiological recordings.
- Input Features: Decompose field potential or calcium transient waveforms into multiple parameters (e.g., 16+ features describing duration, amplitude, and kinetics) [49].
- Model Training: Train classifiers (e.g., Random Forest, XGBoost) on datasets containing healthy and arrhythmic hiPSC-CMs.
- Application: Deployed ML models can distinguish between different arrhythmic subtypes with high accuracy (>90%), providing an unbiased, complementary method to conventional analysis [49].
This application note outlines a standardized framework for employing MEA systems to phenotype hiPSC-CMs within arrhythmia research. The detailed protocols for generating atrial-specific cardiomyocytes, coupled with robust data acquisition and analysis workflows, provide researchers with a powerful toolset. The integration of quantitative MEA parameters and advanced analytical techniques, such as machine learning, enhances the predictive power of hiPSC-CM models for investigating disease mechanisms and profiling drug-induced cardiotoxicity.
Engineered Heart Tissues and 3D Models for Arrhythmia Studies
The study of cardiac arrhythmias has been transformed by the development of engineered heart tissues (EHTs) and three-dimensional (3D) models derived from human induced pluripotent stem cells (iPSCs). These advanced models overcome the significant limitations of traditional two-dimensional (2D) cell cultures and animal models, which often fail to recapitulate human-specific disease mechanisms and tissue-level electrophysiology [16] [50]. Arrhythmias frequently stem from genetic mutations in ion channels or structural proteins, and patient-specific iPSC-derived cardiomyocytes (iPSC-CMs) enable direct investigation of these electrophysiological abnormalities at the cellular level [16]. The integration of these cells into 3D tissues provides a critical bridge between cellular pathology and whole-heart physiology, offering unprecedented opportunities for disease modeling, drug screening, and the development of regenerative therapies [51] [16].
Types of 3D Cardiac Models and Their Applications
Various 3D cardiac models have been established, each with distinct advantages for arrhythmia research. The table below summarizes the key characteristics and applications of these advanced experimental platforms.
Table 1: Overview of 3D Engineered Heart Tissue Models for Arrhythmia Studies
| Model Type | Key Characteristics | Primary Applications in Arrhythmia Research | Notable Advantages |
|---|---|---|---|
| Engineered Heart Tissues (EHTs) | 3D tissues often formed using bioengineering approaches like bioprinting or casting; can incorporate multiple cell types and extracellular matrices [50]. | - Drug response evaluation [50]- Disease modeling- Transplantation studies | - Recapitulates tissue-level architecture and force generation- Overcomes immaturity of 2D cultures [50] |
| Cardiac Spheroids | Spherical aggregates of hPSC-CMs formed through self-assembly [50]. | - High-throughput cardiotoxicity testing [50]- Early-stage drug screening | - Simple fabrication without complex equipment- Suitable for scalable assays |
| Cardiac Organoids | Mini-organ-like structures designed to closely resemble the native heart's cellular composition and structure [50]. | - Modeling complex disease pathologies (e.g., ischemia) [52]- Developmental studies | - Contains multiple relevant cell types (fibroblasts, smooth muscle, inflammatory cells) [52] |
| Heart-on-a-Chip (HoC) | Microfluidic chip-based technology incorporating cardiac tissues [50]. | - Real-time monitoring of contraction and electrical activity [50]- Capturing natural tissue development | - Provides multifaceted, dynamic functional data- Enables continuous monitoring |
| 3D Bioprinted Constructs | Predefined architectures created via layer-by-layer deposition of bioinks containing cells and biomaterials [51]. | - Creating patient-specific cardiac patches [51]- Modeling chambered structures [51] | - High spatial control over cell placement and alignment- Excellent reproducibility and multi-material patterning [51] |
Experimental Protocols for 3D Model Generation and Arrhythmia Assessment
Protocol 1: Generation of 3D Bioprinted Cardiac Tissues
Principle: 3D bioprinting places cells and biomaterials in predefined architectures to program alignment, stiffness, vascular pathways, and electrical coupling that better recapitulate native myocardium compared to conventional 3D casting [51].
Materials:
- Bioprinter: Extrusion-based bioprinter (common for cardiac applications) [51]
- Bioink: Natural-synthetic hybrid (e.g., GelMA-based) combining bioactivity with tunability; may include conductive components [51]
- Cells: iPSC-derived cardiomyocytes (iPSC-CMs), optionally co-cultured with cardiac fibroblasts or endothelial cells [51]
- Supporting Equipment: Computer with CAD/CNC software for digital design [51]
Procedure:
- Digital Design: Use computer-aided design (CAD) tools and computer numerical control (CNC) systems to generate coordinate files (e.g., g-code) that guide the bioprinter in creating the desired tissue geometry [51].
- Bioink Preparation: Formulate a sterile bioink. For a natural-synthetic hybrid, this may involve combining a natural polymer like decellularized extracellular matrix (dECM) with a synthetic polymer like polyethyleneglycol (PEG). Mix the iPSC-CMs uniformly into the bioink at a high cell density (e.g., 10-100 million cells/mL, depending on the bioprinting technique) [51].
- Printer Setup and Optimization: Load the cell-laden bioink into the printer's cartridge. Optimize key parameters including nozzle diameter, extrusion speed, temperature, layer thickness, and number of layers. These variables must be fine-tuned to maintain cell viability and construct fidelity [51].
- Bioprinting: Execute the print job via layer-by-layer deposition according to the digital design. For extrusion bioprinting, this involves the continuous deposition of a filament of bioink onto a substrate or into a support bath.
- Post-Printing Maturation: Transfer the printed construct to a bioreactor for maturation. Culture the tissue under conditions that promote electromechanical maturation, potentially including chemical and mechanical stimulation [52]. The culture medium should be changed regularly.
Notes: The choice of bioprinting technique (jetting, light-based, extrusion, or volumetric) involves trade-offs in resolution, speed, and compatible bioink viscosity [51]. Post-printing, constructs require comprehensive evaluation of structural and functional properties [51].
Protocol 2: Functional Characterization of 3D Tissues Using Microelectrode Array (MEA)
Principle: MEA recordings non-invasively measure the extracellular field potential of 3D cardiac tissues, providing critical parameters for assessing arrhythmogenic risk and drug responses, such as the corrected field potential duration (FPDc), which correlates with the QT interval in an electrocardiogram [53].
Materials:
- MEA System: Setup including a multi-electrode array plate, amplifier, and data acquisition software [53].
- Test Platform: 3D cardiac tissue (EHT, spheroid, or bioprinted construct) derived from patient-specific iPSC-CMs, preferably from patients with known inherited arrhythmia syndromes (e.g., Long QT Syndrome, Brugada Syndrome) [53].
- Compounds: Drugs with known or unknown Torsades de Pointes (TdP) risk for screening [53].
- Environmental Chamber: Maintained at 37°C and 5% CO₂ during recordings.
Procedure:
- Tissue Preparation: Transfer the mature 3D cardiac tissue to the recording chamber of the MEA plate. Ensure the tissue is in good contact with multiple electrodes.
- System Equilibration: Add pre-warmed culture medium to the MEA plate. Place the plate in the MEA setup and allow the system to equilibrate for at least 15-30 minutes under physiological conditions (37°C, 5% CO₂) to stabilize the tissue's beating rate.
- Baseline Recording: Record the field potential for a minimum of 2-3 minutes under spontaneous beating conditions or during electrical pacing at a fixed frequency (e.g., 1 Hz). Key parameters to extract include:
- Beat Period (BP): The interval between consecutive beats.
- Field Potential Duration (FPD): The time from the initial depolarization spike to the end of the repolarization wave.
- FPD Correction (FPDc): Apply a correction formula (e.g., FPDc = FPD / √(BP)) to account for heart rate variations, analogous to the QTc in clinical ECG [53].
- Amplitude: The magnitude of the depolarization spike.
- Compound Application: Apply the test compound at the desired concentration. Incubate for a predetermined time (e.g., 15-30 minutes) to allow for full effect.
- Post-Compound Recording: Record the field potential again for 2-3 minutes using the same parameters as the baseline.
- Data Analysis: Calculate the percentage change from baseline for FPDc, BP, and amplitude. Compare responses between healthy (control) and disease-specific tissues (e.g., LQTS) to identify genotype-specific cardiotoxicity [53].
Notes: This protocol is the basis for high-throughput screening and machine learning model training. Disease-specific lines (e.g., LQTS) show heightened sensitivity to potassium channel blockers, while Brugada Syndrome lines may be hypersensitive to calcium channel blockers, enabling precise risk assessment [53].
Protocol 3: Accelerated Maturation of iPSC-CMs for Enhanced Arrhythmia Modeling
Principle: The inherent immaturity of standard iPSC-CMs is a major source of arrhythmogenic risk in models. This protocol uses combined chemical and mechanical stimulation to rapidly mature iPSC-CMs, yielding cells and tissues with more adult-like characteristics in a little over a week, much faster than conventional methods [52].
Materials:
- Cells: iPSC-CMs, preferably already differentiated into ventricular, atrial, or nodal subtypes.
- Maturation Medium: Standard cardiomyocyte culture medium, potentially supplemented with specific maturation-promoting factors (e.g., thyroid hormone T3, corticosteroids, or fatty acids).
- Bioreactor System: A system capable of applying mechanical stress (e.g., static stretching) to the 3D tissues [52].
Procedure:
- Pre-Maturation: Differentiate iPSCs into cardiomyocytes using standard protocols.
- Chemical Stimulation: Culture the cells or 3D tissues in the maturation medium for the duration of the process. The specific additives should be optimized for the cell type and desired outcome.
- Mechanical Stimulation: For 3D tissues (EHTs or bioprinted constructs), apply uniaxial or cyclic strain using the bioreactor. The specific regimen (e.g., 5-10% stretch) must be optimized.
- Monitoring: Monitor the maturation progress regularly. Assess functional maturity via MEA (as in Protocol 2) or patch-clamp electrophysiology, and structural maturity via immunostaining for mature sarcomeric proteins (e.g., organized α-actinin) and ion channels.
- Harvesting: After 1-3 weeks, the matured tissues can be used for experimental studies. The accelerated timeline of ~1 week for some methods allows for quicker model establishment [52].
Notes: This accelerated maturation is critical for generating more physiologically relevant and stable models for arrhythmia studies, as it promotes the suppression of automaticity and improves calcium handling, thereby reducing proarrhythmic backgrounds [16] [52].
Performance Data of 3D Models in Drug Screening
The utility of these models is demonstrated in quantitative screens. The table below summarizes key performance metrics from a machine learning-driven drug screening study using patient-specific iPSC-CMs.
Table 2: Performance of Machine Learning Models in Predicting Drug-Induced Cardiotoxicity Using Patient-Derived iPSC-CMs
| Model Component | Parameter / Metric | Result / Value | Context & Significance |
|---|---|---|---|
| Experimental Data | Number of Compounds Tested | 28 compounds | Compounds with varying known Torsades de Pointes (TdP) risk levels [53] |
| Cell Lines Used | iPSC-CMs from patients with Long QT Syndrome (LQTS) and Brugada Syndrome (BrS) | Genetically confirmed and phenotypically characterized lines for disease-specific screening [53] | |
| Machine Learning Model (ANN) | Predictive Accuracy (AUC) | 0.94 | Area Under the Curve for the Artificial Neural Network model trained on LQTS iPSC-CM data [53] |
| Disease-Specific Drug Responses | BrS Line Sensitivity | Hypersensitivity to calcium channel blockers | Reveals genotype-specific cardiotoxicity profiles [53] |
| LQTS Line Sensitivity | Heightened responses to potassium channel inhibitors | Confirms expected pathophysiological mechanism and validates platform [53] |
The Scientist's Toolkit: Essential Research Reagents and Materials
Successful generation and analysis of 3D cardiac models require a suite of specialized reagents and equipment.
Table 3: Essential Research Reagents and Materials for 3D Arrhythmia Models
| Category | Item | Function / Application |
|---|---|---|
| Cells | Induced Pluripotent Stem Cells (iPSCs) | Foundational patient-specific cell source for generating all downstream cardiac cell types [16] [52]. |
| iPSC-Derived Cardiomyocytes (iPSC-CMs) | Differentiated cells that form the contractile and electrical units of the engineered tissue; can be ventricular, atrial, or nodal-like [50] [52]. | |
| Supporting Cells (e.g., Cardiac Fibroblasts, Endothelial Cells) | Used in co-culture to enhance tissue maturity, stability, and model complexity by providing paracrine signals and structural support [51] [52]. | |
| Biofabrication | Bioinks (Natural-Synthetic Hybrids, GelMA) | Hydrogels that serve as the 3D scaffold for cells during bioprinting; combine the bioactivity of natural polymers with the mechanical tunability of synthetic ones [51]. |
| Extrusion Bioprinter | A device for the layer-by-layer deposition of cell-laden bioinks to create complex, predefined 3D tissue architectures [51]. | |
| Functional Analysis | Microelectrode Array (MEA) System | A platform for non-invasively recording extracellular field potentials from 3D tissues to assess electrophysiological parameters and arrhythmic behavior [53]. |
| Patch Clamp Electrophysiology | A gold-standard technique for detailed, single-cell analysis of action potentials and ionic currents in cardiomyocytes [16]. | |
| Data Analysis | Machine Learning Models (e.g., Artificial Neural Networks) | Computational tools trained on MEA data to accurately predict genotype-specific cardiotoxicity risks from compound screens [53]. |
Workflow Diagrams for 3D Model Generation and Screening
The following diagrams illustrate the key experimental and analytical workflows in arrhythmia studies using 3D engineered tissues.
3D Cardiac Model Generation and Maturation Workflow
Diagram Title: 3D Cardiac Model Generation Pipeline
Arrhythmia Risk Screening and ML Analysis Pipeline
Diagram Title: Arrhythmia Risk Screening with Machine Learning
Comprehensive in Vitro Proarrhythmia Assay (CiPA) Implementation
The Comprehensive in Vitro Proarrhythmia Assay (CiPA) initiative represents a transformative paradigm in cardiac safety pharmacology, established to address the limitations of previous hERG-centric testing strategies. Spearheaded by regulatory agencies including the US Food and Drug Administration (FDA), CiPA aims to enhance the prediction of clinical proarrhythmic risk through a integrated mechanistic approach [54] [55]. This framework moves beyond reliance solely on hERG potassium channel inhibition and QT interval prolongation as surrogate markers, which while sensitive, demonstrated low specificity and potentially led to the premature attrition of valuable therapeutic compounds [55]. The CiPA strategy rests on three foundational pillars: 1) evaluation of drug effects on a panel of key human cardiac ion channels; 2) incorporation of these data into in silico models of the human ventricular action potential to predict proarrhythmic risk; and 3) confirmation of this risk classification using human-induced pluripotent stem cell-derived cardiomyocytes (hiPSC-CMs) [55]. This application note details the implementation of this integrated framework, with emphasis on experimental protocols utilizing hiPSC-CMs, to support researchers and drug development professionals in adopting this advanced safety assessment platform.
Core CiPA Components and Workflow
The CiPA workflow integrates multiple experimental and computational components to form a comprehensive risk assessment. Figure 1 below illustrates the logical relationships and sequential flow of this paradigm.
Figure 1. The Comprehensive CiPA Workflow. This diagram outlines the three core pillars of the CiPA initiative and the logical sequence for integrated proarrhythmic risk assessment. The process begins with detailed ion channel profiling, proceeds to in silico modeling, and concludes with experimental confirmation using hiPSC-CMs to inform a final risk classification and development decision.
Materials and Reagents
Research Reagent Solutions
Successful implementation of CiPA-compliant assays requires specific biological reagents, instrumentation, and software. The table below catalogues the key materials essential for establishing these protocols.
Table 1: Essential Research Reagents and Platforms for CiPA Implementation
| Item | Function/Application in CiPA | Example Specifications/Notes |
|---|---|---|
| hiPSC-CM Cell Lines | Provides a physiologically relevant human cardiomyocyte platform for integrated arrhythmia risk assessment [28]. | YBLiCardio [28], iCell Cardiomyocytes2 [56]; purity >85% cTnT-positive [57]. |
| MEA System | Non-invasive, label-free measurement of extracellular field potentials from spontaneously beating cardiomyocyte networks [58] [59]. | Multiwell systems (e.g., Axion Biosystems) for throughput; measures FPD (analogous to QT interval) and arrhythmic profiles [59]. |
| Automated/Manual Patch Clamp | Gold-standard for high-fidelity measurement of compound effects on specific human cardiac ion channels (hERG, NaV1.5, CaV1.2) [60] [61]. | Utilizes standardized voltage protocols and solutions; capable of verifying drug concentrations in solution [60]. |
| CardioExcyte 96 System | Records extracellular signals via impedance and field potential measurements from 96-well plates, functioning similarly to MEAs [28]. | Enables high-throughput screening of drug effects on beat patterns and QT prolongation [28]. |
| hiPSC-CM Culture Media | Supports maintenance and functional maturation of cardiomyocytes post-thawing/differentiation. | Advanced MEM base, supplemented with triiodo-L-thyronine (T3) and dexamethasone to promote maturity [58]. |
| CiPA Reference Compounds | Validated drug set for assay calibration and qualification. Used to demonstrate predictive accuracy. | 28-drug panel including high-, intermediate-, and low-risk compounds; e.g., E4031, moxifloxacin, quinidine, verapamil [60] [56]. |
Key Experimental Protocols
Protocol: Cardiotoxicity Assessment using hiPSC-CMs on MEA
This protocol details the use of Multi-Electrode Array systems for assessing proarrhythmic risk, based on established CiPA methodologies [58] [59] [56].
Workflow Overview:
Figure 2. Experimental workflow for cardiotoxicity assessment of compounds using hiPSC-CMs on Multi-Electrode Array systems.
Step-by-Step Procedure:
hiPSC-CM Culture and Plating:
- Utilize commercially available or in-house differentiated hiPSC-CMs (e.g., YBLiCardio, iCell Cardiomyocytes2) [28] [56].
- Plate cells onto Matrigel-coated 48- or 96-well MEA plates at a density optimized for forming synchronously beating monolayers (e.g., 100,000 - 150,000 cells per well of a 48-well plate) [58] [59].
- Maintain cells in specialized maturation medium (e.g., Advanced MEM with T3 and dexamethasone) for up to 30 days to enhance electrophysiological maturity, changing the medium every 48 hours [58].
Baseline Recording:
- Prior to compound addition, place the MEA plate in the recording instrument maintained at 37°C and 5% CO₂.
- Record spontaneous field potentials from all active electrodes for a minimum of 10-15 minutes to establish a stable baseline for parameters like Field Potential Duration (FPD), beat rate (BR), and spike amplitude [59].
Compound Application and Testing:
- Prepare stock solutions of test articles and reference compounds in DMSO, followed by serial dilution in pre-warmed cell culture medium. Ensure the final DMSO concentration is ≤0.3% [28].
- Apply at least four concentrations of the test compound covering a range from below to above the expected therapeutic plasma level. Include vehicle control wells.
- For each concentration, record field potentials for 30-60 minutes post-application to capture steady-state drug effects [28] [58].
Data Analysis:
- Field Potential Duration (FPD): Analyze the interval from the initial sodium spike (depolarization) to the peak of the T-wave (repolarization). Normalize FPD for changes in beat rate using Fridericia's correction (FPDc = FPD / RR interval^1/3) or a similar method [28] [59].
- Arrhythmia Detection: Manually and algorithmically scan recordings for the presence of triggered activities such as Early Afterdepolarizations (EADs), Tachycardia, or irregular beat patterns [58] [56].
- Risk Assessment: Classify proarrhythmic risk based on the concentration-dependent prolongation of FPDc and the induction of arrhythmic events, benchmarked against the responses of CiPA reference compounds [28].
Protocol: Ion Channel Assay using Automated Patch Clamp
This protocol describes a calibrated high-throughput automated patch clamp (APC) assay for hERG or NaV1.5, critical for Pillar 1 of CiPA and for variant pathogenicity assessment [60] [61].
Workflow Overview:
Figure 3. Generalized workflow for high-throughput automated patch clamp analysis of cardiac ion channels.
Step-by-Step Procedure:
Cell Preparation:
- Use mammalian cell lines (e.g., HEK293 or CHO) stably expressing the human ion channel of interest (hERG/KV11.1, NaV1.5/SCN5A, CaV1.2) [60].
- Harvest cells using standard enzymatic methods and resuspend in appropriate external solution at a density optimized for the specific APC platform.
Electrophysiology and Voltage Protocols:
- Transfer cell suspension to the APC platform. Establish whole-cell configuration in each well/chip.
- For hERG current (I_Kr), use a "step-ramp" voltage waveform mimicking the ventricular action potential: from a holding potential of -80 mV, depolarize to +40 mV, then repolarize to -40 mV [60].
- For NaV1.5 (peak I_Na), apply a protocol from a holding potential of -120 mV to a range of test potentials to assess steady-state activation (SSA) and inactivation (SSI) [61].
- Maintain recording temperature at 35-37°C for physiological relevance [60].
Compound Application and Data Collection:
- Perfuse cells with external solution containing the test compound. Test a minimum of four concentrations, chosen to adequately define the concentration-inhibition curve.
- Verify final drug concentrations in the recording chamber via bioanalysis where possible to account for non-specific drug loss [60].
- Record currents in response to voltage protocols before and after application of each drug concentration.
Data Analysis and Quality Control:
- Measure peak current amplitude for each concentration. Normalize current to cell capacitance (pA/pF) to calculate current density.
- Fit normalized current-concentration data to a Hill equation to determine the half-maximal inhibitory concentration (IC50).
- Implement strict quality control criteria. For SCN5A-BrS assays, a minimum of 36 cells per variant is recommended to detect a 25% difference in current density with 90% power [61].
- Calculate Z-scores relative to the distribution of benign control variants to classify functional effect (e.g., Z > -2: normal; Z < -4: severe loss-of-function) [61].
Quantitative Data and Risk Assessment
hiPSC-CM Response to Reference Compounds
Data generated from hiPSC-CM platforms enable quantitative risk assessment by benchmarking against known reference compounds. The following table summarizes exemplary experimental data.
Table 2: Representative hiPSC-CM (YBLiCardio) Responses to CiPA Reference Compounds [28]
| Drug | CiPA Risk Classification | Effect on FPD (% Change vs. Baseline) | Arrhythmic Events Observed | Notes |
|---|---|---|---|---|
| Droperidol | High (reclassified) | +173% | Likely EADs/TdP | Originally intermediate; identified as high-risk. |
| Domperidone | High (reclassified) | +182% | Likely EADs/TdP | Originally intermediate; identified as high-risk. |
| Chlorpromazine | Varies | Enhanced Prediction | Not Specified | Model showed improved predictive accuracy. |
| E-4031 | High | Prolongation, EADs Triggered | EADs | Positive control for hERG block [56]. |
| Verapamil | Low | Minimal FPD prolongation | None | Multichannel blocker (hERG & CaV1.2). |
| Ranolazine | Low | Minimal FPD prolongation | None | Multichannel blocker (late Na+ current). |
Key Electrophysiological Parameters in hiPSC-CMs
Establishing baseline electrophysiological characteristics is crucial for experimental design and data interpretation.
Table 3: Baseline Electrophysiological Parameters of hiPSC-CMs in MEA Assays
| Parameter | Typical Value/Range | Notes |
|---|---|---|
| Field Potential Duration (FPD) | 350 - 450 ms | Corrected (FPDc) for beat rate; analogous to QT interval [56]. |
| Beat Rate | Variable, often 0.5 - 2 Hz | Spontaneous beating frequency is cell line and culture condition dependent. |
| Spike Amplitude | Cell line dependent | Reflects the sodium influx and depolarization phase. |
The implementation of the CiPA paradigm, as detailed in these application notes, marks a significant advancement in preclinical cardiac safety testing. The integrated use of hiPSC-CMs within this framework provides a more physiologically relevant and human-specific platform for assessing proarrhythmic risk, overcoming the limitations of traditional animal models and hERG-focused assays [57] [58]. The protocols outlined herein—for MEA and automated patch clamp assays—provide a clear pathway for researchers to generate robust, reproducible data that can reliably inform drug development decisions.
The success of this approach is evidenced by its ability to reclassify drugs like droperidol and domperidone as high-risk, consistent with clinical observations, and to provide enhanced prediction for compounds like chlorpromazine [28]. Furthermore, the adaptability of hiPSC-CMs allows for the incorporation of patient-specific genetic backgrounds, paving the way for personalized medicine approaches in cardiotoxicity screening [58].
In conclusion, the CiPA initiative, supported by standardized protocols using hiPSC-CMs, offers a powerful, mechanistic, and human-relevant strategy for proarrhythmia risk assessment. Its adoption, reinforced by the FDA Modernization Act 2.0, is poised to accelerate safer drug discovery and development while reducing the current reliance on animal models [57].
Addressing iPSC-CM Limitations: Maturation and Arrhythmogenic Risk Mitigation
The immaturity of human induced pluripotent stem cell-derived cardiomyocytes (iPSC-CMs) represents a significant bottleneck in their application for disease modeling, particularly for inherited arrhythmia studies, and drug safety screening. While these cells hold immense promise as an unlimited source of patient-specific cardiomyocytes, their fetal-like characteristics limit their ability to fully recapitulate adult cardiac pathophysiology [7] [62]. This application note details integrated strategies to overcome this limitation by systematically promoting structural and functional maturation of iPSC-CMs, thereby enabling more physiologically relevant arrhythmia research.
The relative immaturity of iPSC-CMs manifests in several critical aspects: disorganized sarcomeric structure, underdeveloped calcium handling machinery, immature metabolic phenotypes relying predominantly on glycolysis, and electrophysiological properties that diverge from adult CMs [62]. These differences can lead to misleading results in drug screening assays; for example, the calcium channel blocker verapamil abolishes iPSC-CM beating at clinically relevant concentrations despite its safe profile in patients, highlighting the translational gap [7]. The protocols outlined herein address these deficiencies through a combinatorial approach targeting metabolic, structural, and electrophysiological maturation simultaneously.
Integrated Maturation Strategies
Metabolic Maturation via Lipid-Enriched Medium
Rationale: Adult cardiomyocytes primarily utilize mitochondrial fatty acid β-oxidation for energy production, whereas immature iPSC-CMs rely predominantly on glycolysis. Shifting this metabolic paradigm is fundamental to achieving functional maturation.
Protocol: Preparation of Lipid-Enriched Maturation Medium
- Base Medium: Begin with a standard cardiomyocyte maintenance medium (e.g., RPMI 1640 with B-27 supplement).
- Fatty Acid Supplementation: Supplement with a lipid mixture containing long-chain fatty acids such as oleic acid (100-200 µM), palmitic acid (100-200 µM), and linoleic acid (50-100 µM). To enhance solubility and cellular uptake, conjugate fatty acids to fatty acid-free Bovine Serum Albumin (BSA) at a 5:1 molar ratio (fatty acid:BSA) before addition.
- Calcium Modulation: Increase the calcium chloride concentration to a final concentration of 2.0-2.5 mM to promote electrophysiological maturation and enhance calcium handling [7].
- Additional Components: Consider adding L-carnitine (1-2 mM) to facilitate fatty acid transport into mitochondria and creatine (5 mM) to support the cellular phosphocreatine energy shuttle.
- Usage: Replace the standard culture medium with the lipid-enriched maturation medium. Refresh every 2-3 days for a minimum of 2-4 weeks to observe significant metabolic maturation.
Structural Maturation via Nanoscale Patterning
Rationale: Implementing micro- and nanopatterning on culture surfaces provides topographical cues that guide cellular alignment and elongation, mimicking the anisotropic architecture of native myocardium and promoting sarcomere organization.
Protocol: Implementing Nanopatterned Surfaces
- Substrate Selection: Use commercially available nanopatterned culture dishes or create custom patterns using soft lithography or electron beam lithography on polydimethylsiloxane (PDMS) or other biocompatible polymers.
- Pattern Specifications: Optimal results are achieved with groove patterns featuring a ridge width of 800-1000 nm, groove width of 800-1000 nm, and a depth of 600-800 nm [7].
- Surface Coating: Prior to cell seeding, coat the patterned surface with an extracellular matrix protein such as fibronectin (10-20 µg/mL) or Matrigel (1-2% dilution) to enhance cell adhesion.
- Cell Seeding: Seed a single-cell suspension of iPSC-CMs (e.g., day 15-20 post-differentiation) at a density of 50,000 - 100,000 cells/cm² onto the coated, patterned surface.
- Outcome: This intervention primarily drives structural maturation, resulting in highly aligned sarcomeres with well-defined striations, elongated nuclei, and improved localization of gap junction proteins like Connexin 43 to the cell membrane [7].
Functional Maturation via Electromechanical Stimulation
Rationale: Applying electrical field stimulation that mimics the native heart rate trains the iPSC-CMs to contract synchronously and regularly, driving the development of adult-like electrophysiological properties and mitochondrial function.
Protocol: Application of Electrical Stimulation
- Equipment Setup: Utilize a commercial or custom-built cell stimulation system capable of delivering biphasic electrical pulses across a cell culture plate via carbon electrodes.
- Stimulation Parameters:
- Frequency: 2 Hz (equivalent to 120 beats per minute) [7].
- Pulse Duration: 2-10 ms.
- Amplitude: 5-10 V/cm, sufficient to capture >90% of the cells and induce synchronous contractions without causing cell death or detachment.
- Stimulation Regimen: Initiate stimulation 24-48 hours after cell seeding. Begin with a milder regimen (e.g., 1-2 V/cm) and gradually increase to the full amplitude over 24 hours. Maintain continuous stimulation for a duration of 2-4 weeks, with the maturation medium being replaced regularly.
- Outcome: Electrostimulation emerges as the key driver for enhancing mitochondrial development, metabolic maturation, and improving action potential properties, including a more negative resting membrane potential and increased upstroke velocity [7].
The following workflow diagram illustrates the integration of these three key strategies:
Quantitative Assessment of Maturation
Rigorous assessment is critical for validating the efficacy of maturation protocols. The table below summarizes key electrophysiological and structural metrics from a study that implemented a combined maturation approach [7].
Table 1: Quantitative Metrics of iPSC-CM Maturation Following Combined Treatment
| Parameter | B27 Control | MM Only | MM + NP | MM + NP + ES (Combined) |
|---|---|---|---|---|
| Resting Membrane Potential (mV) | -44.1 ± 9.8 | -49.7 ± 8.5 | -58.2 ± 7.4 | -65.6 ± 8.5 |
| AP Amplitude (mV) | Data in [7] | Data in [7] | Data in [7] | Significant Increase |
| AP Upstroke Velocity, Vmax (V/s) | 4.2 ± 1.4 | 5.0 ± 1.1 | 6.6 ± 2.5 | 11.0 ± 7.4 |
| Conduction Velocity (cm/s) | 12.5 ± 5.8 | 22.3 ± 3.7 | 25.6 ± 4.3 | 27.8 ± 7.3 |
| Sarcomere Organization | Disorganized | Disorganized | Highly Organized | Highly Organized |
| Cx43 Membrane Localization | Low | Low | Increased | High |
| Notch-and-Dome AP Morphology | Not observed | Not observed | Not observed | Observed in 43% of CMs |
Abbreviations: MM (Maturation Medium), NP (Nanopatterning), ES (Electrical Stimulation), AP (Action Potential), Cx43 (Connexin 43). Data adapted from [7].
Experimental Protocols for Functional Validation
Patch Clamp Electrophysiology for Action Potential Recording
Objective: To characterize the electrophysiological maturation of iPSC-CMs by recording action potentials.
- Equipment: Patch clamp amplifier, data acquisition system, vibration isolation table, micromanipulators, heated chamber to maintain 37°C.
- Solutions:
- External Tyrode's Solution (mM): NaCl 140, KCl 5.4, CaCl₂ 1.8-2.5 (use higher end for matured cells), MgCl₂ 1, HEPES 5, Glucose 10; adjust pH to 7.4 with NaOH.
- Internal Pipette Solution (mM): KCl 120, MgATP 5, Na₂Phosphocreatine 5, EGTA 10, MgCl₂ 1, HEPES 10; adjust pH to 7.2 with KOH.
- Procedure:
- Use borosilicate glass capillaries to fabricate patch pipettes with a resistance of 2-4 MΩ.
- Place a coverslip with matured iPSC-CMs in the recording chamber and perfuse with external Tyrode's solution.
- Approach the cell with the pipette and apply gentle suction to form a Giga-ohm (GΩ) seal.
- Compensate pipette capacitance and rupture the patch of membrane under the pipette tip by additional suction or a brief voltage zap to achieve whole-cell configuration.
- Record action potentials in current-clamp mode (I=0) while pacing the cell at 0.5 Hz or 1 Hz. Measure key parameters: Resting Membrane Potential (RMP), Action Potential Amplitude (APA), Maximum Upstroke Velocity (Vmax), and Action Potential Duration at 90% repolarization (APD90) [7] [62].
Immunofluorescence Confocal microscopy for Structural Analysis
Objective: To assess sarcomere organization and intercalated disc protein localization.
- Reagents: Primary antibodies: Anti-α-actinin (sarcomeres), Anti-Connexin 43 (gap junctions), Anti-Ryanodine Receptor 2 (RYR2, calcium release units). Fluorescently-labeled secondary antibodies. Phalloidin (for F-actin staining). Hoechst or DAPI (for nuclear staining). Permeabilization buffer (0.1-0.5% Triton X-100), blocking buffer (e.g., 5% normal goat serum).
- Procedure:
- Fixation: Wash cells with PBS and fix with 4% paraformaldehyde for 15 minutes at room temperature.
- Permeabilization and Blocking: Incubate with permeabilization buffer for 10 minutes, then with blocking buffer for 1 hour.
- Antibody Staining: Incubate with primary antibodies diluted in blocking buffer overnight at 4°C. Wash with PBS and incubate with appropriate secondary antibodies for 1 hour at room temperature, protected from light.
- Counterstaining and Mounting: Incubate with phalloidin and Hoechst stain for 15-30 minutes. Wash and mount the coverslips onto glass slides using an anti-fade mounting medium.
- Imaging and Analysis: Acquire high-resolution z-stack images using a confocal microscope. Analyze images for sarcomere length, alignment, and the colocalization of proteins like RYR2 with α-actinin striations [7].
The signaling pathways and cellular components modulated by these maturation strategies are complex. The following diagram summarizes the key molecular players and their interactions in the matured iPSC-CM:
The Scientist's Toolkit: Essential Research Reagents
Table 2: Key Reagents for iPSC-CM Maturation Protocols
| Item | Function/Description | Example/Catalog Consideration |
|---|---|---|
| Fatty Acid-BSA Conjugates | Provides essential lipids to shift metabolism from glycolysis to fatty acid β-oxidation. | Oleic acid (C18:1), palmitic acid (C16:0), and linoleic acid (C18:2) conjugated to fatty acid-free BSA. |
| Nanopatterned Surfaces | Provides topographical cues for cellular alignment and organized sarcomerogenesis. | Commercially available plates with defined microgrooves (e.g., 800-1000 nm width/depth). |
| Carbon Electrodes & Stimulator | Delivers controlled electrical pulses for synchronous contraction and electrophysiological maturation. | C-Dish & C-Pace systems or custom-built setups for chronic 2 Hz stimulation. |
| Anti-α-Actinin Antibody | Labels Z-discs for visualization and quantification of sarcomere structure and length via immunofluorescence. | Mouse or rabbit monoclonal antibodies for high specificity. |
| Anti-Connexin 43 Antibody | Stains gap junctions to assess their maturation and proper localization to the cell-cell junctions. | Antibodies targeting the non-phosphorylated (internal) and phosphorylated (membrane) forms. |
| L-Type Calcium Channel Blocker | Pharmacological tool for validating calcium handling maturity (e.g., Verapamil, Nifedipine). | Used in dose-response assays to test for adult-like pharmacological responses. |
| Patch Clamp Setup | Gold-standard for functional electrophysiological characterization (APs, ion currents). | Requires amplifier, micromanipulator, data acquisition software, and temperature controller. |
The integration of metabolic modulation, structural guidance, and chronic electromechanical stimulation presents a powerful and necessary approach for driving iPSC-CMs toward an adult-like phenotype. The detailed application notes and protocols provided here offer a roadmap for researchers to generate more predictive and physiologically relevant in vitro models of the human heart. The adoption of these matured iPSC-CM models is crucial for advancing our understanding of inherited arrhythmia mechanisms and for improving the accuracy of pre-clinical cardiotoxicity and efficacy screening in drug development.
Electrical Stimulation and Mechanical Loading Protocols for Maturation
The immaturity of human induced pluripotent stem cell-derived cardiomyocytes (iPSC-CMs) remains a significant bottleneck in cardiovascular research, particularly for the precise study of arrhythmia mechanisms and drug safety pharmacology [63] [7] [15]. These cells typically exhibit a fetal-like phenotype, characterized by disorganized sarcomeres, absent T-tubules, spontaneous automaticity, and immature electrophysiological properties, which limit their predictive value [7] [15]. To bridge this gap, advanced functional maturation protocols that mimic the in vivo cardiac environment are essential. This application note provides detailed methodologies for applying electrical stimulation and mechanical loading, two key biophysical cues proven to drive iPSC-CMs toward an adult-like phenotype [64] [65] [66]. The protocols are framed within the context of enhancing the fidelity of iPSC-CM models for arrhythmia studies.
Key Maturation Outcomes of Stimulation Strategies
Biophysical stimulation drives iPSC-CMs toward a more mature state across structural, functional, and metabolic domains. The table below summarizes key outcomes achieved through these strategies.
Table 1: Maturation Outcomes of Electrical and Mechanical Stimulation on iPSC-CMs
| Maturation Domain | Specific Parameter | Effect of Electrical Stimulation | Effect of Mechanical Loading |
|---|---|---|---|
| Electrophysiology | Resting Membrane Potential (RMP) | More negative (e.g., -70 mV vs. -55 mV) [67] | Not specifically reported |
| Action Potential Upstroke Velocity (Vmax) | Increased (e.g., 11.0 V/s vs. 4.2 V/s) [7] | Not specifically reported | |
| Conduction Velocity (CV) | Increased (e.g., 27.8 cm/s vs. 12.5 cm/s) [7] | Not specifically reported | |
| Calcium Handling | Calcium Transient Amplitude | Increased amplitude [67] | Significant increase observed [65] |
| Calcium Transient Kinetics | Faster rising slope and decay rates [67] | Improved calcium cycle [65] | |
| Contractile Function | Contractile Force | Enhanced force generation [64] [68] | Significant increase in contractility [65] |
| Force-Frequency Relationship (FFR) | Development of a positive FFR [67] [68] | Not specifically reported | |
| Structure & Gene Expression | Sarcomere Organization | Highly organized sarcomeres with H-, A-, M-, I-, and Z-bands [64] [67] | Notably better structural maturation [65] |
| Key Gene Expression | Upregulation of MYH7, TNNT2, CACNA1C, KCNH2 [64] [7] |
Elevated gene expression of cTnT and Nkx2.5 [65] |
|
| Subcellular Structures | Presence of T-tubules and desmosomes [64] [67] | Not specifically reported |
Detailed Experimental Protocols
Electrical Stimulation Protocol for 3D Cardiac Tissues
Principle: Exogenous electrical pacing mimics the physiological depolarization initiated by pacemaker cells in the adult heart, promoting electrophysiological and structural maturation [64] [67].
Materials:
- Cell Source: iPSC-derived cardiomyocytes. (Co-culture with cardiac fibroblasts, e.g., in a 75:25 ratio, is recommended for engineered heart tissues [64] [67]).
- 3D Scaffold: Suitable platform such as engineered heart tissue (EHT) hanging pillars or cardiac spheroids [64] [67].
- Bioreactor: A system equipped with electrodes capable of delivering controlled electrical field stimulation, such as a C-Pace unit from IonOptix or similar custom setups [64] [7].
- Culture Medium: Standard cardiomyocyte maintenance medium, potentially supplemented with fatty acids for metabolic maturation [7].
Procedure:
- Tissue Fabrication: Generate 3D engineered cardiac tissues (ECTs) using your method of choice (e.g., collagen-based EHTs or self-assembled spheroids).
- Initiation of Stimulation: Begin electrical stimulation after the tissues demonstrate synchronous, spontaneous contractions, typically around day 7-10 of culture [64].
- Stimulation Parameters: Apply a monophasic, rectangular waveform with the following optimized parameters [64] [67] [7]:
- Field Voltage: 2.5 - 6 V/cm (adjust to achieve consistent, paced contractions without arcing).
- Pulse Duration: 2 - 10 ms.
- Frequency: 1 - 2 Hz (60 - 120 beats per minute) to mimic the adult human resting heart rate.
- Duration: 10 - 14 days, with the medium changed every 48-72 hours.
Notes: The transition from 2D to 3D culture alters the electrical field distribution; therefore, parameters like voltage and pulse duration may require optimization for specific platform geometry [64].
Cyclic Mechanical Stretching Protocol for 2D/3D Cultures
Principle: Applying controlled uniaxial strain mimics the preload experienced by the heart, enhancing structural alignment, contractile force, and calcium handling [65] [66].
Materials:
- Stretch Chamber: Commercially available systems (e.g., PDMS stretch chambers from Menicon or similar) with flexible membranes [65].
- Stimulation Instrument: A device capable of applying cyclic strain to the chambers (e.g., ShellPa Pro from Menicon) [65].
- Cell Source: iPSC-CMs, optionally co-cultured with supporting cells such as human gingival fibroblasts (HGF) or cardiac fibroblasts to improve tissue formation and maturation [65].
Procedure:
- Surface Coating: Coat the flexible membrane of the stretch chamber with an appropriate extracellular matrix protein (e.g., Matrigel at 35.5 µl/ml) [65].
- Cell Seeding: Seed a mixture of iPSCs and HGFs (e.g., 4.9 x 10^5 iPS cells and 2.1 x 10^5 HGFs per well) onto the coated membrane and initiate cardiomyocyte differentiation [65].
- Initiation of Stretching: Begin mechanical stimulation during the maturation phase, typically from day 15 of differentiation [65].
- Stretching Parameters: Apply cyclic uniaxial stretch with the following parameters [65]:
- Strain Amplitude: 5 - 10% elongation.
- Frequency: 0.5 - 1 Hz (matching the spontaneous beating rate of immature iPSC-CMs).
- Duration: Apply stimulation continuously for 72 hours to several days.
Combined Electro-Dynamic Stimulation Protocol
Principle: Simultaneous application of electrical and mechanical cues more closely recapitulates the native electromechanical environment of the heart, potentially leading to synergistic maturation effects [68].
Materials: As per the individual electrical stimulation and mechanical stretching protocols.
Procedure:
- Tissue Preparation: Generate ECTs as described in Section 3.1.
- Integrated System Setup: Place the engineered tissues within a bioreactor system that can provide controlled electrical pacing and cyclic mechanical stretch simultaneously.
- Stimulation Parameters: Apply both stimuli concurrently for 2 weeks [68]:
- Electrical Stimulation: 2 Hz frequency, 5 V/cm field voltage.
- Mechanical Stretching: 5% strain, 2 Hz frequency.
Note: This combined approach has been shown to significantly enhance contractile force, calcium handling, vascular network formation, and the development of a positive force-frequency relationship compared to either stimulus alone [68].
The Scientist's Toolkit: Essential Research Reagents and Materials
Successful implementation of maturation protocols requires specific tools and reagents. The following table catalogs key solutions for this field.
Table 2: Essential Research Reagents and Materials for iPSC-CM Maturation Studies
| Item Name | Function/Application | Specific Example/Note |
|---|---|---|
| StemMACS CardioDiff Kit XF | Xeno-free differentiation of iPSCs into cardiomyocytes. | Essential for clinical translation; generates iCMs under GMP-compliant conditions [69]. |
| PDMS Stretch Chamber | Applies cyclic mechanical strain to 2D or 3D cell cultures. | Chamber size: 20 x 20 mm; used with mechanical stimulation instruments [65]. |
| ShellPa Pro | Instrument to apply controlled cyclic stretching to flexible chambers. | Used to deliver precise mechanical loading protocols [65]. |
| C-Pace EM | Cell culture stimulator for delivering electrical field pacing. | Enables controlled electrical stimulation in standard multi-well plates [64]. |
| Matrigel | Basement membrane matrix for coating culture surfaces. | Provides a biologically relevant substrate for cell attachment and tissue organization (e.g., diluted to 35.5 µl/ml for coating) [65]. |
| Lipid-Enriched Maturation Medium | Promotes metabolic maturation by shifting energy dependence from glycolysis to fatty acid oxidation. | Often supplemented with fatty acids like palmitate, oleate, and linoleate [7]. |
| RNA-Switch Technology | Purification of iPSC-CMs by eliminating undifferentiated iPSC contaminants. | Uses microRNA-specific (e.g., miR-1 for CMs, miR-302 for iPSCs) toxin mRNA to ensure population safety and purity [69]. |
| iMatrix-511 (Laminin-511 E8) | Defined, xeno-free coating substrate for iPSC and iPSC-CM culture. | Supports robust cell attachment and expansion while maintaining pluripotency or differentiated state [69]. |
Workflow and Signaling Pathways
The following diagram illustrates a consolidated experimental workflow for maturing iPSC-CMs, integrating the key protocols described in this note.
Figure 1: Experimental Workflow for iPSC-CM Maturation.
The application of biophysical stimuli activates specific intracellular signaling cascades that drive the maturation process. The diagram below outlines the key pathways involved.
Figure 2: Key Signaling Pathways in iPSC-CM Maturation.
{{ // Define color palette const blue = "#4285F4"; const red = "#EA4335"; const yellow = "#FBBC05"; const green = "#34A853"; const white = "#FFFFFF"; const lightGray = "#F1F3F4"; const darkGray = "#202124"; const mediumGray = "#5F6368"; }}
Metabolic Maturation: Transition from Glycolytic to Oxidative Metabolism
The physiological immaturity of human induced pluripotent stem cell-derived cardiomyocytes (iPSC-CMs) remains a significant limitation in cardiovascular research, particularly for arrhythmia studies and drug development. A principal aspect of this immaturity is their characteristic fetal metabolic phenotype, relying primarily on glycolysis for energy production rather than the oxidative metabolism that dominates in adult cardiomyocytes [70] [71]. During native cardiac development, cardiomyocytes undergo a significant metabolic switch shortly after birth, shifting from glycolytic metabolism to mitochondrial oxidative phosphorylation, with fatty acids becoming the predominant energy source, accounting for approximately 60-70% of ATP production in adult hearts [70] [72]. Recapitulating this metabolic transition in vitro is crucial for generating iPSC-CMs with adult-like electrophysiological properties, calcium handling, and contractile function, thereby enhancing their fidelity for modeling cardiac arrhythmias and predicting drug responses [73] [26].
Key Metabolic Characteristics and Assessment Methods
Comparative Metabolic Profiles
The table below summarizes the fundamental metabolic differences between immature iPSC-CMs, matured iPSC-CMs, and adult cardiomyocytes, highlighting key parameters relevant to arrhythmia research.
Table 1: Metabolic Characteristics Across Cardiomyocyte Maturation Stages
| Metabolic Parameter | iPSC-CMs (Immature) | Matured iPSC-CMs | Adult Cardiomyocytes |
|---|---|---|---|
| Primary Energy Source | Glucose/Glycolysis [70] [72] | Mixed Glycolysis/Fatty Acid Oxidation [73] | Fatty Acid Oxidation (60-70% of ATP) [70] [71] |
| Mitochondrial Morphology | Rounded, sparse cristae, perinuclear [70] [73] | Elongated, denser cristae, sarcomere-aligned [70] [7] | Elongated, dense cristae, highly organized between sarcomeres [70] |
| Glycolytic Contribution to ATP | >50% [72] | Reduced (protocol-dependent) [73] | <10% [72] |
| Oxygen Consumption Rate (OCR) | Lower basal and maximal OCR [73] | ~30% increase in maximal OCR [73] | High oxidative capacity |
| Fatty Acid Uptake/Oxidation | Very low [72] | Significantly increased [73] [7] | High capacity, primary pathway |
| Metabolic Flexibility | Limited | Developing [71] | High (can switch between substrates) [71] |
Functional Assessment Protocols
Reliable assessment of metabolic maturation is essential for validating the efficacy of any maturation protocol. Below are key methodologies used for functional characterization.
Table 2: Key Assays for Characterizing Metabolic Maturation
| Assay Type | Measured Parameters | Protocol Overview |
|---|---|---|
| Seahorse Extracellular Flux Analysis [73] | Oxygen Consumption Rate (OCR), Extracellular Acidification Rate (ECAR), Spare Respiratory Capacity | Culture cells in Seahorse microplates. Measure basal OCR/ECAR, then sequential injections of Oligomycin (ATP synthase inhibitor), FCCP (mitochondrial uncoupler), and Rotenone/Antimycin A (Complex I/III inhibitors). Calculate metabolic parameters from the resulting profile. |
| Fatty Acid Oxidation Assay [73] | Palmitate oxidation rate | Incubate cells with (^{13}\text{C})-labeled palmitate. Measure the production of (^{13}\text{CO}_2) or labeled TCA cycle intermediates using mass spectrometry to quantify complete fatty acid oxidation. |
| Immunofluorescence & Flow Cytometry [73] [7] | Mitochondrial content, organization, membrane potential | Fix cells and stain with antibodies against Tom20 (mitochondrial marker) and α-actinin (sarcomeric marker). Use confocal microscopy to assess mitochondrial localization and organization. Flow cytometry quantifies total mitochondrial content. |
| Metabolomic Tracing [74] | Nutrient utilization pathways (e.g., glucose, glutamine) | Culture cells with stable isotope-labeled nutrients (e.g., (^{13}\text{C})-Glucose). Analyze incorporation of labels into metabolic intermediates (e.g., lactate, TCA cycle metabolites) via LC-MS to map flux through different pathways. |
Established Maturation Protocols and Reagents
Metabolic Maturation Media Formulation
Supplementing culture media with specific metabolites, hormones, and fatty acids is a foundational strategy to drive the metabolic switch. The following protocol is adapted from studies demonstrating enhanced electrophysiological and contractile maturation [73] [75].
Base Medium: RPMI 1640 or DMEM without glucose [73] Supplements:
- Fatty Acid Source: 1-2% Albumin-conjugated fatty acids (AlbuMAX) [73] [7] or a defined fatty acid mixture (e.g., palmitate, oleate).
- Energy Substrates: 3-5 mM Glucose, 1-5 mM Lactate, 0.5-1 mM β-Hydroxybutyrate (ketone body) [73].
- Cardio-Protective/Auxiliary Molecules: 5 mM Creatine, 2-5 mM L-Carnitine, 5 mM Taurine [73].
- Hormones: 1-100 nM Triiodothyronine (T3), 100-200 nM Dexamethasone [71].
- Calcium: Adjust final Ca²⁺ concentration to ~1.8 mM to support adult-like contractility and electrophysiology [73] [7].
Protocol:
- Differentiate iPSCs into cardiomyocytes using a standard protocol (e.g., Wnt modulation).
- At day 20-30 post-differentiation, replace the standard maintenance medium (e.g., RPMI/B27) with the metabolic maturation medium.
- Change the medium every 2-3 days.
- Maintain cells in maturation medium for a minimum of 3-5 weeks to observe significant metabolic and functional improvements [73].
Integrated Maturation Strategy
Recent evidence suggests that combining metabolic conditioning with biophysical cues yields a synergistic effect, promoting comprehensive structural, metabolic, and electrophysiological maturation [7]. The workflow for this integrated approach is as follows:
Diagram 1: Integrated Maturation Workflow. This combined approach sequentially applies metabolic, structural, and electrical stimuli to drive comprehensive maturation [7].
Key Steps for Integrated Protocol:
- Metabolic Priming: Culture iPSC-CMs in metabolic maturation medium (as described in section 3.1) for 1-2 weeks [7].
- Calcium Adjustment: Incorporate elevated calcium (~1.8 mM) in the medium to promote electrophysiological maturity, evidenced by more negative resting membrane potential and increased sodium current dependence [7].
- Structural Alignment: Plate cells on nanopatterned surfaces (e.g., 2 μm line patterns) to induce sarcomere alignment and improved cytoarchitecture. This enhances the regularity of Z-bands and the localization of connexin 43 to the cell membrane [7].
- Electrical Conditioning: Apply chronic electrical pacing, typically at 1-2 Hz, for a further 2-4 weeks. Electrostimulation is a key driver of mitochondrial development, oxidative capacity, and adult-like action potential morphology [7].
The Scientist's Toolkit: Essential Research Reagents
Table 3: Key Reagent Solutions for Metabolic Maturation of iPSC-CMs
| Reagent / Material | Function in Maturation | Example Usage & Notes |
|---|---|---|
| AlbuMAX or Fatty Acids [73] | Provides essential fatty acids (e.g., palmitate, oleate) to induce and sustain fatty acid β-oxidation pathways. | Use at 1-2% (w/v) in base medium. Pre-conjugate to fatty-acid-free BSA for defined mixtures. |
| L-Carnitine [73] | Facilitates transport of long-chain fatty acids into the mitochondrial matrix for β-oxidation. | Supplement at 2-5 mM. Essential for functional fatty acid oxidation. |
| Creatine [73] | Serves as a buffer for intracellular ATP/ADP ratios, supporting energy homeostasis in high-demand states. | Use at 5 mM. Improves contractile function and stress resilience. |
| Triiodothyronine (T3) [71] | Thyroid hormone that regulates expression of metabolic genes and promotes mitochondrial biogenesis. | Typical concentration range is 1-100 nM. |
| Nanopatterned Substrates [7] | Provides topographical cues to direct sarcomere alignment and organized myofibril assembly. | Micro-contact printing with fibronectin on PDMS is common. Optimal line width is ~2 μm. |
| Electrostimulation Chambers [7] | Enables chronic electrical pacing of cells, mimicking in vivo physiological conditioning. | Carbon rod or plate electrodes in culture medium. Typical regimen: 2 Hz, 2-4 weeks. |
Impact on Arrhythmia Research and Disease Modeling
The metabolic state of iPSC-CMs directly influences critical electrophysiological parameters. Matured iPSC-CMs demonstrate a more negative resting membrane potential, faster action potential upstroke velocity (indicating greater sodium current dependence), and the appearance of a distinct "notch-and-dome" morphology due to enhanced transient outward potassium current (Iₜₒ) [7]. These features are essential for accurate modeling of channelopathies like Long QT Syndrome (LQTS) and Brugada Syndrome.
The application of maturation protocols has proven critical for reliable disease modeling. For instance, matured iPSC-CMs from a patient with Long QT Syndrome type 3 (caused by SCN5A mutations) showed a more pronounced pathological response to the sodium channel blocker tetrodotoxin, unlike their immature counterparts which were resistant [73]. This enhanced fidelity is crucial for predictive drug screening and safety pharmacology, as matured cells express more adult-like ion channel profiles and demonstrate drug responses that better correlate with clinical observations [7] [26].
Driving the metabolic maturation of iPSC-CMs from a glycolytic to an oxidative phenotype is a requisite step for generating physiologically relevant models for arrhythmia research and cardiotoxicity testing. While individual strategies like metabolic media supplementation yield significant improvements, the most robust outcomes are achieved through integrated approaches that combine biochemical, structural, and electrical stimuli [7]. The protocols and reagents detailed herein provide a foundation for researchers to enhance the maturity of their iPSC-CM models, thereby increasing the translational value of their findings in cardiovascular science and drug development.
Overcoming Cellular Heterogeneity and Proarrhythmic Potential
The translation of induced pluripotent stem cell-derived cardiomyocytes (iPSC-CMs) from research tools to clinical therapeutics for arrhythmia studies and cardiac repair represents a paradigm shift in cardiovascular medicine. These patient-specific cells provide unprecedented opportunities for disease modeling, drug screening, and regenerative applications [63] [16]. However, their clinical application faces significant hurdles, primarily stemming from cellular heterogeneity and inherent proarrhythmic potential [76]. Current differentiation protocols typically yield mixed populations of ventricular-like, atrial-like, and pacemaker-like cardiomyocytes, creating electrical instability that can trigger engraftment arrhythmias (EAs) following transplantation [76]. This Application Note outlines standardized protocols and analytical frameworks to address these critical challenges, enabling the production of safer, more therapeutically viable iPSC-CM populations for research and clinical applications.
Key Challenges and Background
Arrhythmogenic Risks in iPSC-CMs
The proarrhythmic profile of iPSC-CMs originates from several interconnected factors. Electrophysiologically, these cells demonstrate spontaneous automaticity, prolonged action potential duration, depolarized resting membrane potentials, and abnormal calcium handling [16]. These characteristics stem from immature ion channel expression and incomplete excitation-contraction coupling, rendering them fundamentally different from adult cardiomyocytes [16].
A primary concern is the cellular heterogeneity inherent in differentiation outputs. This heterogeneity manifests at both population and tissue scales, generating electrical dispersion that fosters arrhythmogenic substrates [16] [76]. Research using porcine models has specifically identified atrial and pacemaker-like cardiomyocytes within transplanted populations as culprit arrhythmogenic subpopulations [76].
Graft-Host Integration Concerns
Studies investigating the interface between iPSC-derived grafts and swine myocardium reveal additional challenges. Optical mapping data demonstrates that electrical propagation from host-to-graft occurs through sparse electrical bridges separated by millimeters, with conduction velocities approximately four-fold slower in graft tissue than host myocardium [30]. Histological analyses consistently show low connexin-43 expression, scar tissue, and misaligned muscle fibers at the graft-host interface, further compromising electrical synchronization [30].
Protocols for Enhanced Cell Production and Purification
GMP-Compliant iPSC-CM Generation
For clinical applications, a robust, standardized protocol for generating transgene- and xenofree iPSC-CMs is essential. The following methodology ensures Good Manufacturing Practice (GMP) compatibility:
- Starting Material: Isolate peripheral blood mononuclear cells (PBMCs) from human blood with appropriate ethical consent using Ficoll-Paque density gradient centrifugation [69].
- Reprogramming: Use Sendai virus-based reprogramming (CytoTune-iPSC 2.1 Sendai Reprogramming Kit) to generate iPSCs. Manually pick emerging colonies based on morphology by day 20 [69].
- Culture Conditions: Maintain iPSCs on iMatrix-511-coated plates with xenofree StemBrew medium, changing medium daily [69].
- Cardiac Differentiation: Employ a defined, xenofree differentiation protocol:
- Mesoderm Induction: Culture iPSCs in mesoderm induction media (MIM) for 24 hours.
- Cardiomyocyte Maintenance: Switch to cardiomyocyte maintenance media (CMM) for 24 hours.
- Cardiac Induction: Transfer to cardiac induction media (CIM) for 24 hours.
- Maintenance: Continue in CMM until day 10-17 [69].
Progenitor Reseeding for Enhanced Purity
Recent advancements demonstrate that reseeding progenitor populations during differentiation significantly improves final cardiomyocyte purity. The following protocol enhances purity by 10-20% without negatively affecting contractility or sarcomere structure [77]:
- Differentiate human pluripotent stem cells toward cardiac lineage.
- Detach and reseed progenitors at two critical stages:
- EOMES+ mesoderm stage
- ISL1+/NKX2-5+ cardiac progenitor stage
- Cryopreserve progenitors at these stages for on-demand CM production.
- Resume differentiation after thawing and reseeding [77].
This method facilitates transition to defined extracellular matrices (fibronectin, vitronectin, laminin-111) and reduces batch-to-batch variability [77].
Purification Strategies to Mitigate Arrhythmogenic Subpopulations
To eliminate arrhythmogenic atrial and pacemaker-like cells, implement surface marker-based purification:
- Target Population: SIRPA+CD90−CD200− cardiomyocytes (non-arrhythmogenic) [76]
- Avoid Population: SIRPA+CD90−CD200+ cardiomyocytes (arrhythmogenic) [76]
For general purification of ventricular cardiomyocytes, RNA-switch technology provides an effective alternative:
- Design: Create mRNA constructs targeting:
- miR-302a-5p for iPSC-specific elimination
- miR-1 for iCM-specific selection [69]
- Transfection: Use Lipofectamine RNAiMAX Transfection Reagent.
- Selection: Apply puromycin (2-4 µg/mL for 24 hours) to eliminate non-transfected cells [69].
- Validation: Assess purity via flow cytometry for cardiac troponin T (CTNT) expression, with targets exceeding 90% purity [69].
Characterization and Functional Validation
Essential Quality Control Metrics
Rigorously characterize final iPSC-CM populations using the following assays:
- qPCR Analysis: Confirm loss of pluripotency markers (OCT4, NANOG) and presence of cardiac markers (TNNT2, MYH6, MYL2) [69].
- Immunofluorescence: Verify sarcomeric organization (α-actinin, cardiac troponin) and gap junction formation (connexin-43) [69].
- Flow Cytometry: Quantify expression of cardiac-specific surface markers (SIRPA, VCAM1) [69].
- Functional Assessment: Employ multi-electrode array (MEA) systems to measure field potential duration and detect irregular beating patterns [78].
- Karyotyping: Ensure genetic stability throughout the process [69].
Quantitative Electrophysiological Parameters
Table 1 summarizes key electrophysiological parameters that should be assessed to evaluate proarrhythmic risk:
Table 1: Key Electrophysiological Parameters for iPSC-CM Characterization
| Parameter | Acceptable Range | Risk Indicator | Assessment Method |
|---|---|---|---|
| Spontaneous Beat Rate | 40-60 bpm | >80 bpm indicates pacemaker-like dominance | MEA [78] |
| Field Potential Duration (FPDc) | 300-400 ms | Prolongation indicates repolarization abnormalities | MEA [78] |
| Conduction Velocity | >10 cm/s | <5 cm/s indicates poor coupling | Optical mapping [30] |
| Arrhythmia Incidence | <5% of samples | >20% indicates high proarrhythmic potential | MEA/pharmacological challenge [78] |
| Graft-Host Conduction | <10 ms delay | >50 ms delay indicates poor integration | Optical mapping [30] |
The Scientist's Toolkit: Essential Research Reagents
Table 2: Key Research Reagent Solutions for iPSC-CM Studies
| Reagent/Category | Specific Examples | Function/Application |
|---|---|---|
| Reprogramming System | CytoTune-iPSC 2.1 Sendai Reprogramming Kit | Footprint-free reprogramming of somatic cells [69] |
| Differentiation Kit | StemMACS CardioDiff Kit XF | Xenofree cardiac differentiation [69] |
| Extracellular Matrix | iMatrix-511, fibronectin, vitronectin, laminin-111 | Substrate for cell adhesion and differentiation [69] [77] |
| Purification Technology | RNA-switch (miR-1, miR-302a-5p); FACS antibodies (SIRPA, CD90, CD200) | Cell population purification [69] [76] |
| Culture Media | Stem Pro-34 SFM, StemBrew, defined differentiation media | Cell maintenance and directed differentiation [69] |
| Functional Assay Systems | Multi-electrode array (MEA), voltage-sensitive dyes, calcium indicators | Electrophysiological assessment [16] [30] [78] |
Visualizing Workflows and Signaling Pathways
iPSC-CM Generation and Purification Workflow
Surface Marker Strategy for Arrhythmogenic Cell Removal
Discussion and Future Perspectives
The protocols outlined in this Application Note provide a comprehensive framework for overcoming cellular heterogeneity and proarrhythmic potential in iPSC-CM research. The integration of GMP-compliant practices, progenitor reseeding, and surface marker-based purification represents a significant advancement toward clinical-grade cardiomyocyte production.
Future directions should focus on further enhancing electrical maturation through extended culture periods, electromechanical conditioning, and 3D tissue engineering approaches. Additionally, standardized safety profiling using the quantitative parameters described herein will enable more accurate assessment of proarrhythmic risk before clinical application.
As the field progresses, the combination of improved differentiation protocols, targeted purification strategies, and comprehensive functional validation will be essential for translating iPSC-CM therapies from promising research tools to safe, effective clinical applications for arrhythmia modeling and cardiac regeneration.
Improving Graft-Host Integration and Reducing Engraftment Arrhythmias
The transplantation of human induced pluripotent stem cell-derived cardiomyocytes (iPSC-CMs) represents a promising therapeutic strategy for remuscularizing the heart following myocardial infarction. However, two significant challenges hamper clinical translation: poor electrical integration between graft and host tissue, and the occurrence of engraftment arrhythmias (EAs). These complications are intrinsically linked to the structural and functional immaturity of iPSC-CMs, suboptimal graft-host interfaces, and cellular heterogeneity within the cardiac grafts. This application note provides detailed methodologies to quantify these challenges and presents targeted protocols to enhance graft-host integration while minimizing arrhythmogenic risk, framed within the context of iPSC-derived cardiomyocyte research for arrhythmia studies.
Quantitative Characterization of Graft-Host Interface Challenges
A comprehensive understanding of the graft-host interface is fundamental to developing improvement strategies. The table below summarizes key electrophysiological and structural parameters that characterize the immature graft-host interface one week post-transplantation.
Table 1: Electrophysiological and Structural Properties of Graft-Host Interface
| Parameter | Host Myocardium | iPSC-CM Graft | Ratio (Graft/Host) | Functional Implications |
|---|---|---|---|---|
| Conduction Velocity | 53-70 mm/s [79] [30] | 14-19 mm/s [79] [30] | ~0.27 (4-fold slower) [79] [30] | Creates conduction heterogeneity, potential unidirectional block |
| Electrical Bridge Density | N/A | N/A | Sparse (separated by millimeters) [79] [30] | Limits bidirectional conduction, promotes source-sink mismatch |
| Primary Conduction Direction | N/A | Host-to-graft only (no graft-to-host observed) [79] [30] | Unidirectional | Precludes reentry but limits functional integration |
| Pacing Rate Tolerance | Sustained up to 3 Hz [79] [30] | Failed at ≥3 Hz [79] [30] | Frequency-dependent block | Risk of rate-dependent conduction failure |
| CX43 Expression | High, organized [79] [30] | Low, disorganized [79] [30] | Markedly reduced | Impairs gap junction formation, slows conduction |
| Muscle Fiber Organization | Highly organized [79] [30] | Disorganized, misaligned [79] [30] | Disordered | Anisotropic conduction, arrhythmia substrate |
| Interface Tissue Composition | Viable myocardium | Scar tissue, non-myocytes abundant [79] [30] | Fibrotic barrier | Physical separation of graft and host |
Experimental Protocols for Assessing Graft-Host Integration
Dual Optical Mapping of Electrical Propagation
Purpose: To simultaneously record electrical activity in host myocardium and iPSC-CM grafts with high spatiotemporal resolution.
Materials:
- Voltage-sensitive fluorescent dye (e.g., Di-4-ANEPPS) for host tissue membrane potential (Vm)
- Genetically encoded calcium indicator (GECI) in iPSC-CMs for graft calcium transients (CaT)
- High-speed dual-camera imaging system
- Programmable electrical stimulator
- 600-μm thick myocardial slices containing engrafted spheroids [79] [30]
Procedure:
- Tissue Preparation: Harvest cardiac slices containing iPSC-CM grafts at desired time points post-transplantation (e.g., 1 week). Maintain slices in oxygenated physiological solution [79] [30].
- Dye Loading: Stain slices with voltage-sensitive dye (e.g., 5-10 μM for 15-20 minutes). iPSC-CMs should be pre-labeled with GECI prior to transplantation [79] [30].
- Optical Mapping Setup: Place tissue in recording chamber with continuous perfusion. Use appropriate excitation/emission filters to separate Vm and CaT signals [79] [30].
- Pacing Protocol: Apply remote bipolar pacing at increasing frequencies (0.5 Hz to 3 Hz). Use 2-ms pulses at 1.5x threshold [79] [30].
- Data Acquisition: Record simultaneously from both cameras at ≥1000 frames per second. Ensure precise temporal alignment of Vm and CaT signals [79] [30].
- Analysis: Calculate conduction velocities in host and graft regions, identify activation sequences, and detect direction of conduction across interface (host-to-graft vs. graft-to-host) [79] [30].
Immunohistological Analysis of Graft-Host Interface
Purpose: To characterize structural integration at the graft-host interface, including gap junction formation and tissue architecture.
Materials:
- Cryostat for sectioning
- Antibodies: anti-CX43 (gap junctions), human-specific KU80 (graft identification), α-sarcomeric actinin (sarcomeric structure), DAPI (nuclei)
- Fluorescence microscope with high-resolution capabilities
Procedure:
- Tissue Preparation: Prepare serial 10-μm thick cryosections from optically mapped slices to correlate functional and structural data [79] [30].
- Immunostaining: Perform standard immunofluorescence protocols with appropriate primary and secondary antibodies.
- Image Acquisition: Capture high-magnification images of the graft-host interface across multiple sections.
- Quantitative Analysis:
Strategic Interventions to Improve Integration and Reduce Arrhythmias
iPSC-CM Pretreatment Protocols
Purpose: To enhance iPSC-CM survival, maturation, and integration potential prior to transplantation.
Table 2: Pharmacological Pretreatment Strategies for iPSC-CMs
| Treatment | Mechanism of Action | Concentration/Duration | Expected Outcome | Key References |
|---|---|---|---|---|
| CHIR99021 + FGF1 | GSK-3 inhibition + proliferation promotion | Combination pretreatment | ~4-fold increase in transplantation rate and cell cycle activity [80] | Fan et al., 2020 [80] |
| Thymosin β4 | Promotes cardiomyocyte survival, angiogenesis, and AKT activation | Pre-treatment before transplantation | Improved engraftment rate and vascularization in porcine MI model [80] | Tan et al., 2021 [80] |
| Y-27632 (ROCK inhibitor) | Regulates cytoskeletal changes, enhances cell adhesion | Pretreatment of iPSC-CMs | Improved transplantation rate and therapeutic effect in MI [80] | Zhao et al., 2019 [80] |
| Metabolic Modulation | Shifts energy production from glycolysis to fatty acid oxidation | Culture in fatty acid-rich, glucose-depleted media | Enhanced structural and metabolic maturation [81] | Multiple sources [81] |
| Starvation Simulation (EBSS) | Activates cellular resilience pathways | Earle's Balanced Salt Solution for 24-48 hours | Promoted structural, metabolic and electrophysiological maturation [80] | Yang et al., 2021 [80] |
| Hypoxic Preconditioning | Activates HIF pathways, upregulates pro-survival factors | 0.5% oxygen for 24 hours | Increased expression of VEGF, Angiopoietin-1, and erythropoietin [80] | Hu et al. [80] |
Detailed CHIR99021 + FGF1 Protocol:
- Culture iPSC-CMs in standard maintenance medium until 70-80% confluence.
- Switch to pretreatment medium containing CHIR99021 (3-6 μM) and FGF1 (10-20 ng/mL).
- Incubate for 48 hours under standard culture conditions (37°C, 5% CO2).
- Wash cells with PBS and dissociate using standard methods for transplantation.
- Use immediately for transplantation to maintain pretreatment effects [80].
Cellular Purification to Reduce Arrhythmogenic Subpopulations
Purpose: To remove arrhythmogenic atrial and pacemaker-like cells from iPSC-CM populations prior to transplantation.
Background: Recent evidence demonstrates that cellular heterogeneity in PSC-CM grafts is mechanistically linked to treatable arrhythmias, with atrial and pacemaker-like cardiomyocytes identified as culprit arrhythmogenic subpopulations [18].
Surface Marker-Based Purification Protocol:
- Cell Preparation: Dissociate iPSC-CMs to single-cell suspension using gentle enzymatic digestion.
- Antibody Staining: Incubate cells with anti-SIRPA, anti-CD90, and anti-CD200 antibodies in sorting buffer for 30 minutes on ice [18].
- Flow Cytometry Sorting: Use FACS to isolate the SIRPA+CD90−CD200− population, which identifies non-arrhythmogenic cardiomyocytes [18].
- Post-Sort Analysis: Validate purity by replating sorted cells and assessing cardiac markers (cTnT, α-actinin) and electrophysiological properties.
- Transplantation: Use purified population for transplantation within 4-6 hours of sorting.
Signaling Pathways in iPSC-CM Maturation and Integration
The following diagram illustrates key signaling pathways that can be targeted to enhance iPSC-CM maturation and graft-host integration:
Comprehensive Workflow for iPSC-CM Preparation and Transplantation
The following diagram outlines an integrated workflow from iPSC-CM differentiation to post-transplantation assessment:
The Scientist's Toolkit: Essential Research Reagents
Table 3: Key Research Reagent Solutions for Graft-Host Integration Studies
| Reagent/Category | Specific Examples | Function/Application | Considerations |
|---|---|---|---|
| Cell Surface Markers | Anti-SIRPA, Anti-CD90, Anti-CD200 | Identification and purification of ventricular-specific CMs [18] | Enrichment of non-arrhythmogenic populations (SIRPA+CD90−CD200−) |
| Small Molecule Inhibitors | CHIR99021 (GSK-3 inhibitor), Y-27632 (ROCK inhibitor) | Enhance proliferation, survival, and engraftment [80] | Optimize concentration and duration to avoid teratoma risk |
| Growth Factors | FGF1, FGF21, Thymosin β4 | Promote angiogenesis, cell survival, and integration [80] | Combination approaches often more effective than single factors |
| Metabolic Modulators | Fatty acids (palmitate), carnitine | Shift metabolism from glycolysis to oxidative phosphorylation [81] | Mimics adult CM metabolism, enhances maturation |
| Optical Mapping Dyes | Di-4-ANEPPS (voltage), Rhod-2 (calcium) | Simultaneous monitoring of host and graft electrophysiology [79] [30] | Requires specialized imaging equipment and analysis software |
| Genetic Reporters | GECI (GCaMP), Voltage-sensitive fluorescent proteins | Selective labeling of graft electrophysiology [79] [30] | Enables distinction between graft and host signals |
| Electrophysiology Tools | Multi-electrode arrays, Patch clamp | In vitro assessment of iPSC-CM maturity and arrhythmogenicity [2] [16] | Critical for pre-transplantation functional validation |
Improving graft-host integration and reducing engraftment arrhythmias requires a multifaceted approach targeting iPSC-CM maturation, purification, and preconditioning. The protocols outlined herein provide a systematic framework for enhancing the electrical and structural integration of iPSC-CM grafts while minimizing arrhythmogenic potential. Key strategies include pharmacological pretreatment to enhance survival and integration, surface marker-based purification to remove arrhythmogenic subpopulations, metabolic manipulation to promote adult-like phenotypes, and comprehensive functional validation through dual optical mapping. Implementation of these approaches will facilitate safer clinical translation of iPSC-CM therapies for cardiac regeneration.
Validating iPSC-CM Models Against Traditional Systems and Clinical Data
The study of cardiac arrhythmias requires highly relevant and translatable experimental models to understand disease mechanisms and test therapeutic interventions. For decades, cardiac research has relied primarily on animal models and scarce primary human cardiomyocytes. While these systems have provided valuable insights, they present significant limitations in replicating human-specific cardiac physiology. The advent of human induced pluripotent stem cell-derived cardiomyocytes (iPSC-CMs) represents a transformative advancement, offering a patient-specific human cell source that captures individual genetic backgrounds. This Application Note provides a comprehensive comparative analysis of these model systems, focusing on their applications in arrhythmia studies, with detailed protocols for implementation. We frame this discussion within the broader context of utilizing iPSC-derived cardiomyocytes for arrhythmia research, providing scientists with practical guidance for model selection and experimental design.
Comparative Model Characteristics
Key Advantages and Limitations of Cardiac Experimental Models
Table 1: Comprehensive comparison of cardiac experimental models for arrhythmia research
| Characteristic | iPSC-CMs | Primary Human Cardiomyocytes | Animal Models |
|---|---|---|---|
| Human physiology | Yes, but immature | Yes, adult phenotype | No, species-specific differences |
| Genetic background | Patient-specific, captures human diversity | Donor-specific | Inbred strains, limited diversity |
| Availability & scalability | Unlimited expansion possible | Very limited, cannot be expanded | Readily available |
| Maturity state | Fetal-like phenotype; requires maturation protocols | Adult maturity | Species-dependent maturity |
| Disease modeling capability | Excellent for inherited disorders; "disease in a dish" | Limited to available donor pathology | Requires genetic modification or induction |
| Throughput potential | High, suitable for drug screening | Low | Medium to high |
| Cost considerations | High initial differentiation, lower per-experiment | Very high | Variable depending on species |
| Regenerative applications | High potential for cell therapy | Not applicable | Limited |
| Ethical considerations | Minimal (somatic cell source) | Donor consent | Significant concerns, especially large animals |
Functional and Technical Comparison
Table 2: Experimental and functional parameters across model systems
| Parameter | iPSC-CMs | Primary Human Cardiomyocytes | Animal Models (Rodent) |
|---|---|---|---|
| Action potential duration | Prolonged compared to adult | Adult human phenotype | Much shorter (mice: ~5ms vs human: ~300ms) |
| Ion channel expression | Complete but immature ratios | Adult human pattern | Species-specific patterns (mouse repolarization depends on Ito, IK,slow1, IK,slow2) |
| Contraction frequency | Variable, often requires pacing | 60-100 bpm (physiological) | Species-dependent (mouse: 500-600 bpm; rat: 260-450 bpm) |
| Calcium handling | Immature, developing SR function | Mature SR function | Species-specific (varying SR contribution) |
| Metabolic profile | Primarily glycolytic | Primarily oxidative | Species-dependent |
| Culturing duration | Long-term (months) possible | Short-term (days) | Varies by preparation |
| Genetic manipulation | Excellent (CRISPR/Cas9) | Very difficult | Well-established in rodents |
| Drug response predictability | High for human translation | Gold standard | Limited translation for specific compounds |
Model-Specific Applications in Arrhythmia Research
iPSC-CM Applications
iPSC-CMs have emerged as a particularly powerful platform for modeling inherited arrhythmia syndromes such as long QT syndrome (LQTS), Brugada syndrome, and catecholaminergic polymorphic ventricular tachycardia (CPVT) [82] [9]. These patient-specific cells recapitulate key electrophysiological phenotypes observed in patients, including action potential prolongation in LQTS models and calcium handling abnormalities in CPVT [2]. The technology enables the study of gene-specific pathologies in a human context, overcoming the limitations of species differences that plague animal models [1]. Additionally, iPSC-CMs serve as an excellent platform for drug screening and cardiotoxicity testing, as demonstrated by studies using multi-electrode array systems to assess proarrhythmic potential of pharmaceutical compounds [58].
Animal Model Applications
Animal models remain invaluable for studying integrated cardiovascular physiology and complex arrhythmia mechanisms that involve multiple cell types and organ systems [83] [84]. Large animal models such as dogs, pigs, and sheep are particularly useful for studying atrial fibrillation mechanisms and therapeutic approaches like ablation, as their cardiac size and electrophysiological properties more closely resemble humans [84]. Small animal models, especially genetically modified mice, excel in mechanistic studies of monogenic arrhythmia syndromes and for high-throughput preliminary drug testing [83]. The ex vivo Langendorff-perfused heart preparation allows for detailed study of cardiac conduction and reentrant arrhythmias while maintaining tissue structure and multiple cell types [83].
Primary Cardiomyocyte Applications
Primary cardiomyocytes from human donors represent the gold standard for evaluating human cardiac physiology and pharmacology but are severely limited by availability [85]. When accessible, these cells provide crucial validation data for findings from iPSC-CM and animal models, particularly for confirming ion channel drug responses and signaling pathways in mature human cardiomyocytes [85] [86]. Primary neonatal rat ventricular myocytes (NRVMs) remain widely used for studies of hypertrophic signaling and apoptotic pathways due to their relative ease of culture compared to adult cardiomyocytes [86].
Experimental Protocols
Protocol 1: Generation and Validation of iPSC-CMs for Arrhythmia Studies
Workflow Overview:
Step-by-Step Procedure:
Somatic Cell Reprogramming
- Obtain human somatic cells (typically skin fibroblasts or peripheral blood mononuclear cells) with appropriate consent
- Reprogram using non-integrating methods (Sendai virus or episomal vectors) expressing OCT4, SOX2, KLF4, and c-MYC
- Culture emerging iPSC colonies in feeder-free conditions with essential supplements
- Validate pluripotency through marker expression (NANOG, SSEA-4) and trilineage differentiation potential
Cardiac Differentiation
- Culture iPSCs to 90% confluency in essential medium
- Initiate differentiation using CHIR99021 (8μM) in RPMI1640 medium supplemented with human albumin and ascorbic acid
- After 48 hours, replace medium with fresh differentiation medium containing Wnt-C59 (2μM)
- Continue culture for 48 hours before switching to basal differentiation medium
- Spontaneous contractions typically appear between days 6-10
Cardiomyocyte Purification
- Replace medium with glucose-free RPMI1640 containing 4mM L-lactic acid for 4 days to metabolically select cardiomyocytes
- Culture purified iPSC-CMs in Advanced MEM medium supplemented with thyroid hormone T3 (100ng/mL) and dexamethasone (1μM) for 30 days to enhance maturation
- Dissociate into single-cell suspensions using TrypLE for experimental use
Functional Validation
- Confirm cardiac identity via immunostaining for cardiac troponin I, sarcomeric α-actinin, and other cardiac markers
- Perform electrophysiological characterization using patch clamp or multi-electrode array systems
- Validate expression of key cardiac ion channels (KCNH2, SCN5A, CACNA1C) via qPCR
Protocol 2: Multi-Electrode Array (MEA) Analysis of Drug-Induced Arrhythmias
Workflow Overview:
Step-by-Step Procedure:
Cell Preparation and Plating
- Seed dissociated iPSC-CMs onto MEA plates pre-coated with 0.1% gelatin at density of 100,000-150,000 cells per well
- Allow cells to adhere and recover for 48 hours in culture medium with regular changes
- Confirm synchronous beating across electrode array before experimentation
Baseline Recording
- Place MEA plate in recording system maintained at 37°C with 5% CO2
- Record field potentials for 3-5 minutes at baseline to establish normal parameters
- Measure baseline field potential duration (FPD), beating rate, and conduction velocity
Drug Application and Recording
- Prepare test compounds at 8 different concentrations in culture medium
- Apply compounds sequentially from lowest to highest concentration
- Record for 10-15 minutes after each application to ensure stable response
- Include positive controls (E4031 for hERG blockade, nifedipine for calcium channel blockade)
- Use LQTS-specific iPSC-CM lines (e.g., KCNH2 mutations) alongside healthy controls
Data Analysis
- Normalize FPD using Fridericia's correction (FPDcF = FPD/RR1/3) or similar method
- Quantify occurrence of early afterdepolarizations (EADs), delayed afterdepolarizations (DADs), and triggered activity
- Calculate concentration-response relationships for FPD prolongation
- Compare drug effects between healthy and disease-specific cell lines
Protocol 3: Animal Model Electrophysiology for Translational Arrhythmia Studies
Step-by-Step Procedure:
Model Selection and Preparation
- Select appropriate species based on research question: mice for genetic studies, rabbits for repolarization studies, or large animals (dogs, pigs) for translational ablation studies
- For genetic models, utilize CRISPR/Cas9 technology to introduce specific arrhythmia-associated mutations
- For acquired arrhythmia models, implement pacing protocols (atrial tachypacing for AF models) or surgical interventions (coronary ligation for ischemic models)
In Vivo Electrophysiological Study
- Anesthetize animals following approved protocols with appropriate hemodynamic monitoring
- Perform catheter-based electrophysiology study with programmed electrical stimulation
- Assess arrhythmia inducibility using specific pacing protocols (burst pacing, extrastimuli)
- Measure effective refractory periods and conduction velocities at multiple sites
Ex Vivo Heart Preparation
- Excise hearts rapidly and cannulate for Langendorff perfusion with oxygenated Tyrode's solution
- Perform optical mapping using voltage-sensitive dyes (e.g., RH237) or potentiometric dyes
- Analyze action potential duration, conduction velocity, and arrhythmia dynamics
- Assess effects of pharmacological interventions on these parameters
The Scientist's Toolkit: Essential Research Reagents and Solutions
Table 3: Key research reagents and materials for cardiac arrhythmia studies
| Category | Specific Reagents/Tools | Application | Notes |
|---|---|---|---|
| Reprogramming | Sendai virus (OCT4, SOX2, KLF4, c-MYC) | iPSC generation from somatic cells | Non-integrating, high efficiency |
| Differentiation | CHIR99021 (Wnt activator), Wnt-C59 (Wnt inhibitor) | Cardiac differentiation from iPSCs | Sequential Wnt modulation critical |
| Selection | Glucose-free medium with lactate | Cardiomyocyte purification | Metabolic selection |
| Maturation | T3 thyroid hormone, dexamethasone | Enhancing iPSC-CM maturity | Improves electrophysiological function |
| Electrophysiology | Multi-electrode array systems, patch clamp setups | Functional assessment | MEA allows high-throughput screening |
| Imaging | Calcium-sensitive dyes (Fluo-4), voltage-sensitive dyes | Calcium handling and AP measurement | Critical for arrhythmia mechanism studies |
| Gene Editing | CRISPR/Cas9 systems | Isogenic control generation, mutation introduction | Essential for causality establishment |
| Reference Compounds | E4031 (hERG blocker), nifedipine (Ca2+ blocker), isoproterenol (β-agonist) | Assay validation and controls | Required for protocol standardization |
The comparative analysis presented in this Application Note demonstrates that iPSC-CMs, animal models, and primary cardiomyocytes each offer distinct advantages and limitations for arrhythmia research. iPSC-CMs excel in patient-specific disease modeling and high-throughput drug screening, while animal models provide critical insights into integrated physiology and complex arrhythmia mechanisms. Primary human cardiomyocytes remain the gold standard for validating human-specific responses but are limited by availability. A sophisticated research approach should strategically integrate these complementary models: using iPSC-CMs for initial human-specific mechanistic studies and compound screening, animal models for validating integrated physiological responses and safety pharmacology, and primary cardiomyocytes when available for final validation of key findings. This multi-faceted approach maximizes the translational potential of arrhythmia research, bridging the gap between basic discovery and clinical application.
Validation of Drug Responses Against Clinical Arrhythmia Outcomes
The translation of preclinical cardiotoxicity data into accurate predictions of clinical arrhythmia risk remains a significant challenge in drug development. Induced pluripotent stem cell-derived cardiomyocytes (iPSC-CMs) have emerged as a powerful human-relevant platform for assessing proarrhythmic potential, bridging the gap between traditional in vitro assays and clinical outcomes [34] [57]. This application note details standardized methodologies for validating iPSC-CM drug responses against clinical arrhythmia endpoints, supporting their integration into the Comprehensive in vitro Proarrhythmia Assay (CiPA) framework and regulatory decision-making [87] [57].
Experimental Protocols
CiPA-Compliant In Vitro Drug Testing on hiPSC-CMs
This protocol evaluates drug effects on a characterized hiPSC-CM line (YBLiCardio) using extracellular field potential (EFP) measurements, aligning with CiPA initiatives [57].
- Key Materials: hiPSC-CMs (e.g., YBLiCardio line), Matrigel-coated culture plates, mTeSR Plus medium, CardioExcyte 96 system or equivalent microelectrode array (MEA) platform, drug compounds of interest [57].
- Procedure:
- Cell Culture and Maintenance: Culture hiPSCs under feeder-free conditions on Matrigel-coated plates. Maintain cells in mTeSR Plus medium, passaging at ~80% confluency [57].
- Cardiomyocyte Differentiation: Differentiate hiPSCs into cardiomyocytes using an optimized protocol (e.g., STEMdiff medium with temporal Wnt signaling modulation) to achieve >85% cardiac troponin T-positive cells [57].
- Drug Exposure: Plate hiPSC-CMs on the recording platform. Test each drug at a minimum of four concentrations, spanning therapeutic and supratherapeutic ranges. Include positive (e.g., known torsadogenic agents) and negative controls [57].
- Functional Assessment: Record extracellular signals from 96 wells simultaneously. For EFP analysis, key parameters include:
- Beat Rate: Changes in spontaneous or field-stimulated beating frequency.
- Spike Amplitude: Reflects sodium current influx.
- QT Interval: Measure the interval between the sodium spike (depolarization) and T-wave (repolarization) [57].
- Data Analysis: Analyze dynamic changes in beat patterns and action potential morphology. Classify compounds based on proarrhythmic risk (low, intermediate, high) according to predefined thresholds (e.g., QT prolongation >150% may indicate high risk) [57].
Clinical Arrhythmia Outcome Validation Using Real-World Data
This methodology quantifies clinical arrhythmia incidence from real-world datasets to validate and refine in vitro iPSC-CM predictions [87].
- Data Sources:
- FDA Adverse Event Reporting System (FAERS): Provides spontaneous reports of drug-associated adverse events, including Torsades de Pointes (TdP) and other ventricular arrhythmias.
- Electronic Health Claims Data (e.g., Truven-MarketScan US Claims Database): Offers individual-level, de-identified healthcare claims information, enabling calculation of incidence rates normalized by prescription volume [87].
- Procedure:
- Data Extraction: Query FAERS and claims databases for specific arrhythmia outcomes (e.g., TdP, ventricular fibrillation, cardiac arrest) associated with target drugs over a defined period.
- Disproportionality Analysis: For FAERS data, calculate the Empirical Bayes Geometric Mean (EBGM) to identify signals where specific arrhythmia events are reported more frequently than expected for a given drug. An EB05 > 2 threshold is commonly used as a positive signal [87].
- Incidence Rate Calculation: Using claims data, calculate the incidence rate of arrhythmias as the number of events per 10,000 person-years of drug exposure. Stratify analyses by patient characteristics (e.g., age, pre-existing cardiovascular conditions, concomitant medications) [87].
- Correlation with In Vitro Data: Compare clinical arrhythmia incidence rates and disproportionality signals with in vitro iPSC-CM risk classifications to assess predictive accuracy [87].
Workflow Diagram
The following diagram illustrates the integrated experimental and clinical validation workflow for assessing drug-induced arrhythmogenic risk.
Research Reagent Solutions
Table 1: Essential Research Reagents and Platforms for iPSC-CM Arrhythmia Studies
| Item | Function / Application | Example Specification / Source |
|---|---|---|
| hiPSC-CM Line | Patient-specific or commercially available cardiomyocytes for drug testing | YBLiCardio cells; >85% cTnT+ purity [57] |
| Differentiation Medium | Directs stem cell differentiation into cardiomyocytes | STEMdiff Cardiac Differentiation Kit [57] |
| Extracellular Recording System | Measures field potentials and conduction properties in cardiomyocyte networks | CardioExcyte 96; Microelectrode Array (MEA) systems [57] |
| Voltage-Sensitive Dyes | Optical mapping of action potential propagation in 2D/3D tissues | Voltage-sensitive fluorescent dyes (e.g., VSD) [30] |
| Calcium Indicators | Monitoring calcium handling and transient abnormalities (e.g., DADs) | Genetically encoded calcium indicators (GECI) [30] |
| Immunocytochemistry Reagents | Characterizing cellular maturity, structure, and coupling | Antibodies for cTnT, α-actinin, Connexin-43 [57] [30] |
Table 2: Exemplary In Vitro iPSC-CM Drug Response Data and Associated Clinical Risk
| Drug | In Vitro iPSC-CM Findings | In Vitro Risk Classification | Clinical Arrhythmia Association (Source) |
|---|---|---|---|
| Droperidol | 173% QT prolongation vs. control [57] | High | Known Torsadogenic risk [57] |
| Domperidone | 182% QT prolongation vs. control [57] | High | Known Torsadogenic risk [57] |
| Chlorpromazine | Enhanced predictive accuracy for cardiotoxicity [57] | Intermediate/High | Post-market proarrhythmic effects [57] |
| Verapamil | Multichannel blocker; may show low proarrhythmic risk in integrated assays [57] | Low | Low TdP risk despite hERG block [57] |
Correlation with Clinical Outcomes
Integrating real-world evidence (RWE) is crucial for validating the clinical predictive value of iPSC-CM assays. Analysis of databases like FAERS and MarketScan allows for the quantification of arrhythmia incidence in diverse patient populations, moving beyond simplistic drug categorization [87]. For instance, disproportionality analysis (EBGM) and incidence rate calculations provide a continuous, quantitative measure of clinical risk that can be directly correlated with the magnitude of effects observed in iPSC-CMs, such as the degree of QT prolongation or the induction of abnormal repolarization [87] [57]. This integrated approach helps refine risk stratification and supports the use of iPSC-CM data in regulatory safety assessments under initiatives like CiPA and the FDA Modernization Act 2.0 [57].
Optical Mapping of Graft-Host Interfaces in Large Animal Models
The transplantation of induced pluripotent stem cell-derived cardiomyocytes (iPSC-CMs) represents a promising therapeutic strategy for remuscularizing the heart after myocardial infarction. However, a significant barrier to clinical translation is the occurrence of engraftment arrhythmias (EAs), transient but serious rhythm disturbances that arise following implantation [30] [88]. Understanding the electrophysiological interactions at the graft-host interface is crucial for mitigating this risk. Optical mapping technologies provide the high spatiotemporal resolution necessary to visualize these complex interactions directly. This Application Note details the use of high-resolution optical mapping to investigate potential arrhythmia mechanisms at the graft-host interface in a swine myocardial infarction model, providing standardized protocols and quantitative benchmarks for the field [30].
Key Findings from Pre-Clinical Optical Mapping Studies
Recent high-resolution optical mapping studies in large animal models have yielded critical quantitative insights into the electrophysiological properties of iPSC-derived grafts and their coupling with host tissue.
Table 1: Key Electrophysiological Parameters at the Graft-Host Interface
| Parameter | Host Myocardium | iPSC-CM Graft | Experimental Conditions |
|---|---|---|---|
| Conduction Velocity | Baseline (~4x faster than graft) | ~4-fold slower than host [30] | Swine myocardial slice, 1-week post-implant [30] |
| Electrical Bridge Spatial Density | N/A | Sparse, spaced millimeters apart [30] | Swine myocardial slice, 1-week post-implant [30] |
| Activation Direction | Host-to-graft propagation observed | No graft-to-host propagation observed [30] | Swine myocardial slice, 1-week post-implant [30] |
| Graft Automaticity | N/A | Observed in 1 of 16 slices (~0.75 Hz rate) [30] | Swine myocardial slice, unpaced [30] |
| Key Histological Feature | Highly organized CX43 expression [30] | Low, disorganized CX43 expression [30] | Immunofluorescence staining [30] |
These findings indicate that one week after implantation, the graft-host interface is characterized by slow conduction and sparse, immature electrical connections. This creates a pro-arrhythmic substrate with the potential for unidirectional block and re-entrant circuits, even though spontaneous re-entry was not directly observed in these acute experiments [30]. The propagation is predominantly unidirectional, from host to graft, with graft automaticity presenting a potential source for focal arrhythmias [30].
Experimental Protocols
Large Animal Model Generation and Tissue Slice Preparation
This protocol describes the creation of a myocardial infarction model in swine, implantation of iPSC-CM spheroids, and preparation of viable cardiac tissue slices for high-resolution optical mapping [30].
Procedure:
- Myocardial Infarction and Implantation:
- Induce myocardial infarction in immunosuppressed swine.
- Implant engineered cardiac tissue (e.g., iPSC-CM spheroids) into the infarct border zone.
- Allow engraftment to proceed for the desired period (e.g., 1 week).
Tissue Slice Harvesting:
- At the study endpoint, harvest the heart.
- Using a vibratome or similar microtome, prepare ~600 µm-thick cardiac slices containing the implanted spheroids.
- Maintain slices in an appropriate physiological solution (e.g., oxygenated Tyrode's solution) to preserve tissue viability.
Fluorescent Labeling:
- Graft-specific labeling: Prior to implantation, label iPSC-CM spheroids with a genetically encoded calcium indicator (GECI) to unambiguously distinguish graft electrical activity [30].
- Pan-tissue voltage staining: Stain the entire cardiac slice with an organic voltage-sensitive fluorescent dye (VSD), such as di-4-ANEPPS or rh-237 [30] [89] [90].
High-Resolution Dual Optical Mapping
This protocol details the setup for simultaneously mapping transmembrane voltage and graft-specific calcium signals to study graft-host interactions [30].
Procedure:
- Apparatus Setup:
- Mount the tissue slice in a perfusion chamber on the stage of an epifluorescence microscope.
- Maintain temperature at 37°C and continuously superfuse with oxygenated, buffered physiological saline.
- Add excitation-contraction uncouplers like blebbistatin (e.g., 15 µM) to the perfusate to eliminate motion artefacts [90].
Optical Mapping:
- Excitation: Illuminate the tissue with light at the appropriate wavelength for the chosen dyes (e.g., 530/50 nm for di-4-ANEPPS or rh-237) [89] [90].
- Emission Filtering: Use a high-speed camera system (e.g., CMOS or EMCCD) and dichroic filters to simultaneously collect:
- Data Acquisition: Acquire data at a high sampling frequency (typically 500-1000 frames per second) to accurately capture action potential upstrokes and propagation [89] [90].
Pacing Protocol:
Signal Processing and Data Analysis
Raw optical mapping data requires processing to improve the signal-to-noise ratio (SNR) before analysis. The following workflow is recommended.
Procedure:
- Data Masking: Create a binary mask to isolate pixels on the cardiac tissue (foreground) from background pixels, which contain noise and should be excluded from analysis [89]. This can be done manually or using automated thresholding algorithms.
- Spatial Filtering (Binning): Improve SNR by averaging each fluorescent pixel with its neighbors. A common approach is a 3x3 uniform binning kernel. Larger kernels (5x5, 7x7) provide greater noise reduction but at the cost of spatial resolution [89].
- Temporal Filtering: Reduce high-frequency noise in the signal. While Fourier-based filters (FIR, IIR) are common, Wavelet Analysis is a superior method for non-stationary signals like action potentials, as it causes less distortion of the sharp upstroke while effectively denoising [91].
- Activation Mapping: Determine the local time of activation for each pixel, typically defined as the time of maximum dV/dt during the action potential upstroke. These times are used to create color-coded activation maps that visualize wavefront propagation [89].
- Conduction Velocity (CV) Analysis: Calculate the speed and direction of wavefront propagation from the activation map using vector analysis [89].
- Action Potential Duration (APD) Mapping: Calculate the time from activation to a specific repolarization level (e.g., APD80) for each pixel to create repolarization maps and assess dispersion of repolarization [89].
Visualizing Graft-Host Interaction Pathways
The electrophysiological interactions between iPSC-CM grafts and host myocardium involve complex pathways that determine arrhythmia risk. The following diagram synthesizes the key components and their relationships as revealed by optical mapping.
The Scientist's Toolkit: Essential Research Reagents and Materials
Successful execution of optical mapping studies at the graft-host interface relies on a specific set of reagents and tools. The following table catalogs key solutions for this application.
Table 2: Research Reagent Solutions for Graft-Host Interface Mapping
| Item | Function/Benefit | Example/Note |
|---|---|---|
| Voltage-Sensitive Dyes (VSDs) | Fluorescently report changes in transmembrane potential across the entire tissue. | di-4-ANEPPS, rh-237 [89] [90] |
| Genetically Encoded Calcium Indicators (GECIs) | Enable specific, unambiguous tracking of electrical activity in labeled iPSC-CM grafts. | Used for graft-specific Ca2+ transient imaging [30] |
| Excitation-Contraction Uncouplers | Eliminate motion artefacts during optical recording by inhibiting contraction. | Blebbistatin (15 µM) [90] |
| iPSC-CM Spheroids | 3D engineered cardiac tissue format for transplantation. | Improves graft survival and structure compared to single cells [30] |
| Polymer Nanofiber Scaffolds | "Molecular vehicles" that restore excitability to solitary cells before engraftment, potentially enabling faster coupling. | Poly-L-lactide (PLLA) fibers coated with human fibronectin [92] |
| Langendorff Perfusion System | Ex vivo apparatus that maintains isolated heart or tissue slices in a physiologically viable state. | Essential for whole heart and tissue slice experiments [90] |
| High-Speed Camera | Photodetector for capturing fluorescence changes at high temporal resolution. | CMOS or EMCCD cameras [89] [90] |
| Computational Models | In silico tools to simulate thousands of graft-host coupling scenarios and test arrhythmia mechanisms. | Histology-based slice models simulating EA [88] |
Regulatory Perspectives and FDA's New Approach Methodologies (NAMs)
The FDA's 2025 "Roadmap to Reducing Animal Testing" marks a pivotal shift in regulatory science, promoting New Approach Methodologies (NAMs) as advanced non-animal testing approaches for drug safety evaluation [93] [94]. This regulatory evolution aligns with growing adoption of human induced pluripotent stem cell-derived cardiomyocytes (iPSC-CMs) for arrhythmia studies, creating a transformative framework for cardiac safety pharmacology. NAMs encompass innovative in vitro (cell-based), in silico (computational), and in chemico approaches designed to provide human-relevant safety data while reducing reliance on traditional animal models [94] [95]. For researchers investigating arrhythmogenic risks of pharmaceutical compounds and therapeutic interventions, this convergence represents an unprecedented opportunity to enhance predictive accuracy while addressing ethical considerations through the "3Rs" principle: Replace, Reduce, and Refine animal use [94].
The imperative for human-relevant cardiac models is underscored by sobering statistics: over 90% of drugs that pass preclinical animal testing fail in human clinical trials, with approximately 30% failing due to unmanageable toxicities, primarily cardiovascular [95]. iPSC-CMs offer a uniquely powerful platform for arrhythmia research because they retain the patient's genetic background, enable investigation of electrophysiological abnormalities at the cellular level, and facilitate personalized safety assessment [63] [16]. This application note provides detailed protocols and regulatory context for implementing NAMs-compliant iPSC-CM approaches in arrhythmia studies, supported by standardized methodologies and analytical frameworks.
Regulatory Framework: FDA NAMs Initiative and Cardiac Safety Assessment
FDA's NAMs Roadmap: Strategic Implementation
The FDA's 2025 initiative represents a coordinated, multi-phase approach to modernize drug safety evaluation:
- Initial focus on monoclonal antibodies (mAbs), followed by expansion to other biological molecules, new chemical entities, and medical countermeasures [93] [95]
- Encouraged incorporation of NAMs data in Investigational New Drug (IND) applications, with potential for streamlined review processes [93] [95]
- Pilot programs allowing select developers to use primarily NAMs-based testing strategies under close FDA consultation [93]
- Acceptance of real-world evidence from countries with comparable regulatory standards where drugs have already been studied in humans [93]
This regulatory modernization is driven by scientific recognition that animal models often poorly predict human responses, coupled with advances in human cell-based technologies that offer superior clinical relevance [95] [96]. The initiative operates through the Interagency Coordinating Committee on the Validation of Alternative Methods (ICCVAM), partnering with federal agencies including the National Institutes of Health (NIH) and Department of Veterans Affairs to accelerate validation and adoption of these innovative methods [93].
Strategic Advantages of NAMs Integration
For arrhythmia researchers, early adoption of NAMs-compliant approaches offers multiple strategic benefits:
Table 1: Advantages of NAMs Integration in Cardiac Safety Assessment
| Advantage | Impact on Arrhythmia Research | Regulatory Benefit |
|---|---|---|
| Human-relevant models | Improved translational accuracy using human iPSC-CMs versus animal models | More predictive safety data supporting clinical trials [95] |
| Faster results | High-throughput capabilities accelerate data collection | Earlier go/no-go decisions in drug development [95] |
| Cost reduction | Lower expenses than animal care and housing | Reduced R&D costs and potentially lower drug prices [93] |
| Mechanistic insights | Real-time functional readouts of electrophysiological activity | Deeper understanding of proarrhythmic mechanisms [95] |
| Standardization | Reduced variability compared to animal models | More reproducible and reliable safety data [95] |
iPSC-CM Arrhythmia Models: Current Limitations and NAMs Solutions
Electrophysiological Limitations of Conventional iPSC-CMs
While iPSC-CMs have revolutionized cardiac research, significant challenges remain in their application for arrhythmia studies. Current iPSC-CM models typically display electrophysiological immaturity compared to adult ventricular cardiomyocytes, including spontaneous automaticity, prolonged action potential duration (APD), and calcium handling abnormalities [63] [16]. These limitations stem from:
- Reduced inward rectifier potassium current (I~K1~) density, resulting in depolarized resting membrane potentials [16]
- Incomplete suppression of HCN channel activity, contributing to pacemaker-like behavior [16]
- Immature sarcoplasmic reticulum function and reduced ryanodine receptor 2 (RyR2) expression, promoting delayed afterdepolarizations (DADs) [16]
- Cellular heterogeneity with mixed ventricular-, atrial-, and nodal-like phenotypes, creating electrical dispersion [16]
These electrophysiological limitations potentially increase proarrhythmic risk in both preclinical modeling and clinical applications, particularly for cell-based therapies where engrafted iPSC-CMs must integrate functionally with host myocardium [63] [30].
NAMs-Compliant Solutions for Enhanced Predictive Accuracy
Advanced NAMs platforms address these limitations through technological innovation:
Table 2: NAMs Platforms for iPSC-CM Arrhythmia Assessment
| Technology | Application in Arrhythmia Studies | Validation Status |
|---|---|---|
| Multi-electrode array (MEA) systems | High-throughput assessment of field potentials and conduction properties | Industry standard for cardiotoxicity screening; used by 9 of top 10 pharma companies [95] |
| Optical mapping systems | High-resolution (~50 µm) analysis of action potential propagation and calcium handling | Validated in swine myocardial infarction models with iPSC-CM grafts [30] |
| Organs-on-chips | Microphysiological systems mimicking human heart tissue structure and function | FDA-recognized for improved human predictability [94] [95] |
| In silico computational models | AI-powered prediction of drug-induced arrhythmogenesis using simulated electrophysiology | Incorporated in FDA draft guidance for regulatory decision-making [93] [97] |
| 3D cardiac spheroids/organoids | Complex, self-organizing models replicating tissue-level arrhythmia mechanisms | Cross-site validation studies demonstrating predictive accuracy [95] |
Application Note: Comprehensive Protocol for NAMs-Compliant Arrhythmia Risk Assessment
Protocol: Optical Mapping of iPSC-CM Graft-Host Interactions
Background: This protocol adapts methodology from Shahannaz et al. and optical mapping studies in swine models to assess arrhythmogenic potential at the graft-host interface [63] [30]. It specifically addresses FDA NAMs requirements for human-relevant safety assessment while providing mechanistic insights into engraftment arrhythmias.
Materials:
- Cell Source: Patient-specific iPSC-CMs differentiated using validated protocols (e.g., Matrix Modular Cardiac Differentiation System)
- Experimental Platform: Maestro MEA system with dual voltage-calcium mapping capability [95]
- Imaging System: High-resolution optical mapping setup (~50 µm resolution) with voltage-sensitive dyes (e.g., VSD) and calcium indicators (e.g., GECI) [30]
- Tissue Constructs: Engineered cardiac tissues or 3D spheroids incorporating iPSC-CMs
Methodology:
Step 1: iPSC-CM Maturation
- Culture iPSC-CMs using advanced maturation protocols (metabolic selection, electromechanical conditioning, 3D microenvironment)
- Verify electrophysiological maturity via patch clamp analysis of I~K1~ density, action potential morphology, and calcium handling properties
- Duration: 30-60 days post-differentiation
Step 2: Graft-Host Interface Modeling
- Establish in vitro graft-host model using human iPSC-CM spheroids co-cultured with rat or human ventricular tissue slices
- Alternatively, implement heart-on-a-chip system with defined graft-host compartments and microelectrode integration
- Validate structural integration via immunostaining for connexin-43 (CX43) at graft-host interface
Step 3: Dual V~m~-CaT Optical Mapping
- Stain preparation with voltage-sensitive dye (e.g., Di-4-ANEPPS) and genetically encoded calcium indicator (GCaMP)
- Acquire simultaneous transmembrane potential (V~m~) and calcium transient (CaT) signals at high spatiotemporal resolution
- Pacing protocols: Incremental pacing (0.5-4 Hz) to assess rate-dependent conduction properties
- Analysis parameters: Conduction velocity, action potential duration (APD~80~), calcium transient duration (CaTD~80~), arrhythmia incidence
Step 4: Proarrhythmic Risk Assessment
- Challenge system with known torsadogenic compounds (positive controls: E-4031, cisapride) and negative controls
- Quantify arrhythmia triggers: Early afterdepolarizations (EADs), delayed afterdepolarizations (DADs), spontaneous activity
- Assess reentry potential through programmed electrical stimulation and conduction anisotropy analysis
Step 5: Data Integration and Regulatory Reporting
- Compile comprehensive dataset including electrophysiological parameters, structural integration metrics, and arrhythmia incidence
- Apply AI/ML analytics for pattern recognition and risk stratification [95]
- Prepare NAMs-based safety report aligned with FDA guidance for regulatory submission
Expected Results and Interpretation
Based on validated studies, this protocol should yield:
Table 3: Quantitative Parameters for Arrhythmogenic Risk Assessment
| Parameter | Low Risk Profile | High Risk Profile | Measurement Technique |
|---|---|---|---|
| Conduction velocity ratio (graft:host) | >0.5 | <0.2 | Optical mapping [30] |
| APD~80~ restitution slope | <1 | >1 | Programmed electrical stimulation |
| CX43 expression at interface | >50% perimeter | <10% perimeter | Immunofluorescence [30] |
| Incidence of triggered activity | <5% cells | >20% cells | Calcium imaging [16] |
| Maximum following frequency | >2 Hz | <1 Hz | Pacing protocol [30] |
Representative results from swine myocardial infarction models demonstrate that iPSC-CM grafts exhibit ~4-fold slower conduction velocity versus host tissue, with sparse electrical bridges spaced millimeters apart [30]. These conditions create a substrate for reentrant arrhythmias, though clinical manifestation depends on interface maturation and electrical stability.
The Scientist's Toolkit: Essential Research Reagent Solutions
Table 4: Key Reagents for NAMs-Compliant iPSC-CM Arrhythmia Studies
| Reagent/Category | Specific Product Examples | Function in Arrhythmia Studies |
|---|---|---|
| iPSC-CM Sources | Axion iPSC Model Standards (AIMS), Commercial iPSC-CM lines | Standardized cardiomyocytes for consistent electrophysiological testing [95] |
| MEA Systems | Maestro MEA, MultiChannel Systems MEA | Label-free measurement of cardiac electrical activity for cardiotoxicity screening [95] |
| Optical Mapping Dyes | Voltage-sensitive dyes (Di-4-ANEPPS), Calcium indicators (Cal-520) | Simultaneous mapping of action potentials and calcium transients [30] |
| Cardiac Maturation Media | Advanced metabolic maturation media, Electromechanical conditioning systems | Enhance electrophysiological maturity of iPSC-CMs [63] [16] |
| 3D Culture Systems | Cardiac spheroids, Engineered heart tissues, Organ-on-chip platforms | Tissue-level modeling of arrhythmia mechanisms [30] [95] |
| Immunostaining Markers | Anti-CX43, Anti-α-actinin, Human-specific KU80 | Assessment of structural integration and gap junction formation [30] |
Regulatory Strategy: Implementing NAMs in iPSC-CM Arrhythmia Research
Pathway to Regulatory Acceptance
Successful integration of NAMs into regulatory submissions requires strategic implementation:
- Early engagement with FDA through pre-IND meetings to discuss NAMs-based testing strategies [95]
- Demonstration of scientific validity through robust technical validation, ideally replicated across multiple laboratories [96]
- Cross-functional collaboration between regulatory, electrophysiology, and data science teams [97]
- Comprehensive documentation of protocols, performance characteristics, and reproducibility metrics [95]
The Foundation for the National Institutes of Health (FNIH) is establishing a Validation Qualification Network (VQN) to define shared data elements and unify reporting practices across preclinical testing, facilitating regulatory acceptance of NAMs [96].
Diagram: NAMs Integration Workflow for iPSC-CM Arrhythmia Assessment
Diagram Title: NAMs Workflow for iPSC-CM Arrhythmia Studies
The integration of FDA's New Approach Methodologies with iPSC-derived cardiomyocyte technology represents a transformative advancement in arrhythmia risk assessment. This paradigm shift from animal-based testing to human-relevant models offers unprecedented opportunities to enhance predictive accuracy, accelerate drug development, and improve patient safety. The protocols and frameworks outlined in this application note provide a validated pathway for researchers to implement NAMs-compliant approaches that satisfy evolving regulatory requirements while advancing the science of cardiac safety pharmacology.
As the field evolves, emerging technologies including AI-powered analytics, complex microphysiological systems, and standardized iPSC-CM maturation protocols will further enhance the predictive validity of these approaches [97] [95]. By adopting these methodologies now, researchers can position themselves at the forefront of regulatory science while contributing to the development of safer cardiovascular therapeutics.
The integration of human induced pluripotent stem cell-derived cardiomyocytes (iPSC-CMs) into cardiovascular research has revolutionized the modeling of inherited cardiac arrhythmias and the assessment of drug-induced cardiotoxicity. These patient-specific cells provide an unparalleled platform for dissecting disease mechanisms and performing high-throughput therapeutic screening in a human-relevant context [2] [3]. Despite their transformative potential, the inherent structural and functional immaturity of conventionally cultured iPSC-CMs has historically limited their predictive accuracy and physiological relevance. This application note details recent groundbreaking advances in iPSC-CM maturation and sophisticated culture platforms, presenting concrete case studies and detailed protocols that collectively enhance the fidelity of in vitro disease modeling and drug discovery applications for cardiac arrhythmias.
Case Studies in Disease Modeling and Drug Discovery
Modeling Inherited Arrhythmias with Patient-Specific iPSC-CMs
iPSC-CMs have been successfully used to model a wide spectrum of inherited cardiac arrhythmias, recapitulating key cellular phenotypes observed in patients. The table below summarizes successful disease modeling case studies for various channelopathies, highlighting the mutated genes and the resulting cellular-level pathological features observed in iPSC-CM models.
Table 1: Successful Disease Modeling of Inherited Arrhythmias using iPSC-CMs
| Syndrome | Causal Gene Variant | Key Cellular Phenotypes in iPSC-CMs | Citation |
|---|---|---|---|
| Long QT Syndrome (LQTS) | KCNQ1 p.(Arg190Gln) |
Prolonged action potential, reduced IKs current, ER retention, increased susceptibility to catecholamine-induced tachyarrhythmia [2]. | [2] |
KCNH2 p.(Thr983Ile) |
Prolonged APD50/APD90, beat irregularity, early afterdepolarizations (EADs), decreased IKr density [2]. | [2] | |
| Brugada Syndrome (BrS) | SCN5A p.(Arg620His)+p.(Arg811His) |
Reductions in INa and Vmax of AP, increased triggered activity, abnormal calcium transients [2]. | [2] |
CACNB2 p.(Ser142Phe) |
Reduction in peak ICa-L, reduced APA and Vmax, increased arrhythmia-like events [2]. | [2] | |
| Short QT Syndrome (SQTS) | KCNH2 p.(Asn588Lys) |
Shortened APD, increased IKr tail current, re-entrant arrhythmias [2]. | [2] |
| Catecholaminergic Polymorphic Ventricular Tachycardia (CPVT) | RYR2 p.(Phe2483Ile) |
Arrhythmias, delayed afterdepolarizations (DADs); rescued by forskolin [2]. | [2] |
CASQ2 p.(Asp307His) |
DADs, oscillatory arrhythmic events, diastolic [Ca2+]i rise, less organised myofibrils [2]. | [2] | |
| Arrhythmogenic Cardiomyopathy (ACM) | PKP2 p.(Leu614Pro) |
Reduced contraction rate and amplitude, reduced expression of plakophilin2 and plakoglobin [2]. | [2] |
Advanced Maturation Enables Accurate Drug Risk Assessment
The functional immaturity of standard iPSC-CMs often leads to misleading drug responses. A landmark 2025 study systematically evaluated a combined maturation approach, demonstrating its power to correct these inaccuracies [98]. The protocol combined a lipid-enriched maturation medium (MM), a high extracellular calcium concentration, nanopatterning (NP) of culture surfaces, and chronic electrostimulation (ES) to drive iPSC-CMs toward an adult-like state.
Key Findings:
- Electrostimulation was identified as the key driver for enhanced mitochondrial development, metabolic maturation, and improved electrophysiological properties.
- High Calcium strongly promoted electrophysiological maturation.
- Nanopatterning primarily facilitated sarcomere organisation and cell alignment [98].
This combined maturation strategy resulted in iPSC-CMs with more negative resting membrane potentials, higher action potential upstroke velocity (Vmax), and the emergence of a characteristic "notch-and-dome" action potential morphology, indicating enhanced maturity [98]. Most importantly, these matured cells showed drug responses that more closely mirrored clinical outcomes which can be misinterpreted with immature cells. For example, the calcium and hERG channel blocker verapamil, which is clinically safe but often abolishes beating in immature iPSC-CMs, showed diminished sensitivity in the matured cells, correcting a critical false-positive risk prediction [98].
Traveling Wave-Paced Monolayers for Maturation and Screening
To bridge the gap between the need for mature tissues and the compatibility with high-throughput drug assessment paradigms like CiPA and JiCSA, a 2024 study integrated a spontaneously originating traveling wave (TW) system with a standard 2D multi-electrode array (MEA) platform [99].
Key Findings:
- The closed-loop cardiac tissue (iCT) was spontaneously paced by a TW at a high frequency (220 ± 74 bpm), promoting structural and functional maturation.
- TW-paced tissues exhibited enhanced sarcomeric organization, well-defined Z-disks, and increased expression of mature markers like β-myosin heavy chain (β-MHC) and connexin 43 (Cx43) [99].
- In drug testing, the TW group showed an improved, more adult-like response to isoproterenol (a β-adrenoceptor agonist) and correctly identified the low torsades de pointes (TdP) risk of ranolazine, with fewer arrhythmic events compared to immature controls [99]. Furthermore, the TW-matured tissues appropriately flagged high- and intermediate-risk TdP drugs (quinidine and pimozide) with increased arrhythmia rates, demonstrating high predictive power [99].
Detailed Experimental Protocols
Combined Maturation Protocol for iPSC-CMs
This protocol, adapted from a comprehensive 2025 study, details the steps to significantly enhance the structural, metabolic, and electrophysiological maturity of iPSC-CMs [98].
Workflow Overview:
Materials and Reagents:
- Ventricular-like iPSC-CMs: Differentiated using established protocols [98].
- Maturation Medium (MM): Base medium supplemented with lipid-rich B27 supplement, fatty acids (e.g., palmitic, oleic, linoleic acids), and other metabolically defining components [98].
- Nanopatterned Surfaces: Culture surfaces with micro- or nano-scale grooves to guide cellular alignment. Can be fabricated via soft lithography or purchased commercially.
- Electrostimulation Equipment: A cell culture stimulator capable of delivering defined field stimuli (e.g., 2 Hz, 5-10 V/cm, 2 ms pulse duration).
Procedure:
- Initial Seeding: On differentiation day 15, dissociate iPSC-CMs and seed them at an appropriate density onto culture plates or nanopatterned surfaces.
- Maturation Medium Culture: Maintain the cells in the specialized Maturation Medium (MM). Change the medium every 2-3 days.
- Nanopatterning: For the NP and MM+NP+ES groups, seed cells onto the nanopatterned surfaces. The grooves will physically constrain and align the cells along a single axis, promoting organized sarcomerogenesis.
- Electrostimulation: After 3-5 days of recovery post-seeding, initiate chronic electrostimulation. Apply a biphasic electrical field stimulation at 2 Hz for a minimum of 10-14 days. Continuously monitor the cultures to ensure consistent pacing.
- Analysis: After the maturation period, cells can be assessed for electrophysiological properties (patch clamp, MEA), structural maturity (immunostaining for sarcomeric α-actinin, Cx43, RYR2), metabolic function (Seahorse Analyzer), and gene expression (RNA-seq) [98].
Suspension Bioreactor Differentiation for High-Yield CM Production
This protocol generates highly reproducible and scalable iPSC-CMs with improved functional properties compared to standard monolayer differentiation, making it ideal for large-scale drug screening [5].
Workflow Overview:
Materials and Reagents:
- Stirred Bioreactor or Spinner Flasks: For suspension culture.
- Small Molecules: CHIR99021 (a GSK-3β inhibitor and Wnt activator), IWR-1 (a Wnt inhibitor).
- Cardiomyocyte Maintenance Medium: RPMI 1640 supplemented with B27 supplement (with or without insulin).
Procedure:
- Quality Control: Begin with high-quality hiPSCs from a Master Cell Bank, confirming pluripotency (e.g., >70% SSEA4+ by FACS) [5].
- Embryoid Body Formation: Dissociate hiPSCs and transfer to the stirred bioreactor system to form embryoid bodies (EBs) in suspension. Monitor EB diameter.
- Mesoderm Induction: When the average EB diameter reaches ~100 µm (typically at 24 hours), add CHIR99021 to a final concentration of 7 µM to activate Wnt signaling and induce mesoderm commitment. Incubate for 24 hours [5].
- Wnt Inhibition and Cardiac Specification: After a 24-hour gap without compounds, add IWR-1 to a final concentration of 5 µM to inhibit Wnt signaling and direct cardiac specification. Incubate for 48 hours [5].
- Culture and Harvest: Continue culture in maintenance medium. Spontaneous contractions are typically observed by differentiation day 5. Cells can be harvested for analysis or cryopreservation from around day 15. This protocol yields ~1.2 million cells per mL with >90% cardiac troponin T (TNNT2) purity [5].
The Scientist's Toolkit: Key Research Reagents & Solutions
Table 2: Essential Reagents for iPSC-CM Differentiation, Maturation, and Phenotyping
| Category | Reagent / Tool | Function / Application |
|---|---|---|
| Differentiation | CHIR99021 | GSK-3β inhibitor; activates Wnt signaling to initiate mesoderm induction [100] [5]. |
| IWR-1 | Tankyrase inhibitor; suppresses Wnt signaling to promote cardiac specification [5]. | |
| Maturation | Fatty Acids (e.g., Palmitate) | Key component of maturation media; shifts cell metabolism from glycolysis to fatty acid oxidation [98]. |
| Nanopatterned Surfaces | Provides topographical cues to direct cell and sarcomere alignment, improving ultrastructural maturity [98]. | |
| Electrostimulation Equipment | Provides chronic electrical pacing to improve electrophysiological maturity and calcium handling [99] [98]. | |
| Characterization | Patch Clamp Electrophysiology | Gold-standard technique for measuring action potentials and specific ion currents in single cells [2] [98]. |
| Multi-Electrode Array (MEA) | Non-invasive platform for recording field potentials and assessing conduction velocity in monolayer cultures [99] [98]. | |
| Calcium Imaging Dyes (e.g., Fluo-4) | Used with fluorescent microscopy to visualize and quantify calcium transient dynamics, key for arrhythmia studies [2]. |
The case studies and protocols detailed herein demonstrate that overcoming the immaturity of iPSC-CMs is not only feasible but critical for unlocking their full potential in arrhythmia research. The strategic integration of metabolic priming, biophysical cues, and chronic electromechanical stimulation produces cardiomyocytes with adult-like features, leading to more physiologically relevant disease models and more accurate prediction of drug-induced cardiotoxicity. Furthermore, the development of scalable differentiation and maturation platforms ensures that these advanced models can be deployed effectively in high-throughput drug discovery pipelines. As these technologies continue to evolve and standardize, iPSC-CMs are poised to become an indispensable tool for developing novel, safer therapeutics for cardiac arrhythmias.
Conclusion
iPSC-derived cardiomyocytes represent a transformative platform for arrhythmia research, bridging the gap between traditional models and human physiology. While significant progress has been made in disease modeling, drug screening, and safety assessment, challenges remain in achieving full cellular maturation, ensuring reliable graft-host integration, and mitigating arrhythmogenic risks. Future directions should focus on standardizing maturation protocols, developing more complex engineered tissue models that incorporate vascularization and immune components, and establishing robust validation frameworks for regulatory acceptance. As these advancements converge, iPSC-CM technology promises to accelerate personalized antiarrhythmic drug development and pave the way for novel regenerative therapies, ultimately improving patient outcomes through more predictive and human-relevant cardiac research.
References
- 1. The role of iPSC research for insight into inherited ... [https://www.sciencedirect.com/science/article/pii/S1547527125025172]
- 2. iPSC-Derived Cardiomyocytes in Inherited Cardiac ... [https://pmc.ncbi.nlm.nih.gov/articles/PMC9953535/]
- 3. Human induced pluripotent stem cell-derived ... [https://www.frontiersin.org/journals/physiology/articles/10.3389/fphys.2024.1475152/full]
- 4. A review of protocols for human iPSC culture, cardiac ... [https://pmc.ncbi.nlm.nih.gov/articles/PMC9405110/]
- 5. Efficient and reproducible generation of human iPSC ... [https://www.nature.com/articles/s41467-024-50224-0]
- 6. A Resource of Gene Expression Data from a Multiethnic ... [https://pmc.ncbi.nlm.nih.gov/articles/PMC11021142/]
- 7. Comprehensive promotion of iPSC-CM maturation by ... [https://www.nature.com/articles/s41467-025-58044-6]
- 8. Characterization of cardiac metabolism in iPSC-derived ... [https://stemcellres.biomedcentral.com/articles/10.1186/s13287-022-03021-9]
- 9. Human induced pluripotent stem cell-derived ... [https://pmc.ncbi.nlm.nih.gov/articles/PMC11424716/]
- 10. Electrophysiological and calcium-handling development ... [https://pmc.ncbi.nlm.nih.gov/articles/PMC10076390/]
- 11. Utilizing human induced pluripotent stem cells to study ... [https://pmc.ncbi.nlm.nih.gov/articles/PMC10589759/]
- 12. Action Potential Morphology of Human Induced Pluripotent ... [https://pmc.ncbi.nlm.nih.gov/articles/PMC4286594/]
- 13. High-throughput optical action potential recordings in ... [https://www.frontiersin.org/journals/cell-and-developmental-biology/articles/10.3389/fcell.2022.1038867/full]
- 14. SNTA1 gene rescues ion channel function and is ... [https://elifesciences.org/articles/76576]
- 15. Progress in engineering functional cardiac tissues from ... [https://www.sciencedirect.com/science/article/abs/pii/S1742706125006762]
- 16. Arrhythmogenic Risk in iPSC-Derived Cardiomyocytes [https://www.mdpi.com/1648-9144/61/11/2056]
- 17. Human induced pluripotent stem cell-derived cardiomyocytes ... [https://pmc.ncbi.nlm.nih.gov/articles/PMC12571874/]
- 18. Cellular heterogeneity of pluripotent stem cell-derived ... [https://www.nature.com/articles/s44161-023-00419-3]
- 19. Protocol for quantifying stem-cell-derived cardiomyocyte ... [https://pmc.ncbi.nlm.nih.gov/articles/PMC11145390/]
- 20. Fast functional maturity [https://www.axionbiosystems.com/resources/application-note/fast-functional-maturity]
- 21. Contractility assessment using aligned human iPSC- ... [https://www.sciencedirect.com/science/article/pii/S1056871924000406]
- 22. Modeling Inherited Arrhythmia Disorders Using Induced ... [https://pmc.ncbi.nlm.nih.gov/articles/PMC5436929/]
- 23. Updates on inherited arrhythmia syndromes (Brugada ... [https://www.sciencedirect.com/science/article/pii/S0033062025000799]
- 24. Induced pluripotent stem cell derived cardiomyocytes as ... [https://www.frontiersin.org/journals/physiology/articles/10.3389/fphys.2012.00346/full]
- 25. Induced Pluripotent Stem Cells in Cardiomyopathy [https://pubmed.ncbi.nlm.nih.gov/40507801/]
- 26. Human induced pluripotent stem cell-derived ... [https://www.frontiersin.org/journals/bioengineering-and-biotechnology/articles/10.3389/fbioe.2025.1687840/full]
- 27. Development of a robust induced pluripotent stem cell ... [https://stemcellres.biomedcentral.com/articles/10.1186/s13287-023-03405-5]
- 28. A new frontier in toxicity testing by evaluating drug-induced ... [https://pubmed.ncbi.nlm.nih.gov/40482844/]
- 29. hiPSC-Cardiomyocyte Platforms Enabling Comprehensive ... [https://insidescientific.com/webinar/hipsc-cardiomyocyte-platforms-enabling-comprehensive-cardiac-toxicity-and-drug-efficacy-evaluation/]
- 30. Optical mapping of the interface between iPSC-derived ... [https://www.nature.com/articles/s41536-025-00434-x]
- 31. Deconvoluting the Cells of the Human Heart with iPSC Technology... [https://pmc.ncbi.nlm.nih.gov/articles/PMC12007454/]
- 32. Induced pluripotent stem cells: An overview | Abcam [https://www.abcam.com/en-us/knowledge-center/stem-cells/induced-pluripotent-stem-cells]
- 33. Tracking single hiPSC-derived cardiomyocyte contractile ... [https://pmc.ncbi.nlm.nih.gov/articles/PMC11208611/]
- 34. Arrhythmogenic Risk in iPSC-Derived Cardiomyocytes [https://pmc.ncbi.nlm.nih.gov/articles/PMC12654781/]
- 35. Comprehensive Maturation of iPSC-Derived Atrial ... - UIC Indigo [https://indigo.uic.edu/articles/thesis/Comprehensive_Maturation_of_iPSC-Derived_Atrial_Cardiomyocytes_to_Model_Genetics_of_Atrial_Fibrillation/26107306]
- 36. Heart-on-a-chip: a revolutionary organ-on-chip platform for ... [https://pmc.ncbi.nlm.nih.gov/articles/PMC11780825/]
- 37. iPSC-Derived Cardiomyocytes in Inherited Cardiac ... [https://pubmed.ncbi.nlm.nih.gov/36830871/]
- 38. Development of an Electroconductive Heart-on-a-Chip Model ... [https://pmc.ncbi.nlm.nih.gov/articles/PMC12619691/]
- 39. Advanced Cardiotoxicity Testing Using iPSC Cardiomyocytes [https://www.news-medical.net/whitepaper/20240920/Advanced-Cardiotoxicity-Testing-Using-Multi-Channel-iPSC-Cardiomyocytes.aspx]
- 40. Progress in engineering functional cardiac tissues from ... [https://pubmed.ncbi.nlm.nih.gov/40939761/]
- 41. Dual- cardiotoxicity evaluation of torsadogenic risk drugs using human... [https://pubmed.ncbi.nlm.nih.gov/41043280/]
- 42. Multi-parametric assessment of compound-induced pro-arrhythmic... [https://www.moleculardevices.com/en/assets/app-note/dd/flipr/multi-parametric-assessment-of-compound-induced-pro-arrhythmic-effects-in-human-ipsc-derived-cardiomyocytes]
- 43. A high-performance extracellular field potential analyzer for ... [https://www.nature.com/articles/s41598-025-88946-w]
- 44. Development of a robust induced pluripotent stem cell ... [https://pmc.ncbi.nlm.nih.gov/articles/PMC10373292/]
- 45. Human induced pluripotent stem cell-cardiomyocytes for ... [https://pmc.ncbi.nlm.nih.gov/articles/PMC11842287]
- 46. CSAHi study: Validation of multi-electrode array systems ... [https://pubmed.ncbi.nlm.nih.gov/26884090/]
- 47. MEA Viewer: A high-performance interactive application for ... [https://journals.plos.org/plosone/article?id=10.1371/journal.pone.0192477]
- 48. MEA Viewer: A high-performance interactive application for ... [https://pmc.ncbi.nlm.nih.gov/articles/PMC5806868/]
- 49. Characterizing arrhythmia using machine learning analysis ... [https://pmc.ncbi.nlm.nih.gov/articles/PMC9391413/]
- 50. Development and application of 3D cardiac tissues derived ... [https://www.sciencedirect.com/science/article/pii/S1347436724000557]
- 51. 3D Bioprinting Functional Engineered Heart Tissues [https://www.mdpi.com/1422-0067/26/21/10707]
- 52. Engineered cardiac tissue is just a heartbeat away [https://www.nature.com/articles/d42473-025-00095-w]
- 53. A machine learning platform for genotype-specific ... [https://www.sciencedirect.com/science/article/pii/S2090123225005491]
- 54. A New Perspective in the Field of Cardiac Safety Testing ... [https://www.sciencedirect.com/science/article/pii/S2472555222070526]
- 55. Comprehensive in Vitro Proarrhythmia Assay (CiPA) initiative [https://metrionbiosciences.com/cipa/]
- 56. Comprehensive suite of assays for assessment ... [https://www.sciencedirect.com/science/article/pii/S1056871925002928]
- 57. CiPA-qualified human iPSC-derived cardiomyocytes [https://www.sciencedirect.com/science/article/abs/pii/S0887233325000943]
- 58. Human induced pluripotent stem cell-cardiomyocytes for ... [https://www.kjpp.net/journal/view.html?doi=10.4196/kjpp.24.413]
- 59. The CiPA Microelectrode Array Assay with hSC-Derived ... [https://www.axionbiosystems.com/resources/publication/cipa-microelectrode-array-assay-hsc-derived-cardiomyocytes-current-protocol]
- 60. Multi-laboratory comparisons of manual patch clamp hERG ... [https://www.nature.com/articles/s41598-025-15761-8]
- 61. Multi-site Validation of a Functional Assay to Adjudicate ... [https://pmc.ncbi.nlm.nih.gov/articles/PMC11335442/]
- 62. Human iPSC - Derived for Investigation of Disease... Cardiomyocytes [https://link.springer.com/article/10.1007/s10557-017-6735-0]
- 63. Arrhythmogenic Risk in iPSC-Derived Cardiomyocytes [https://pubmed.ncbi.nlm.nih.gov/41303891/]
- 64. Electrical stimulation: a missing key to promote maturation ... [https://www.frontiersin.org/journals/bioengineering-and-biotechnology/articles/10.3389/fbioe.2025.1686342/full]
- 65. Effect of mechanical stretching stimulation on maturation of ... [https://pmc.ncbi.nlm.nih.gov/articles/PMC12368239/]
- 66. mechanical and electrical stimulation approaches - PubMed [https://pubmed.ncbi.nlm.nih.gov/40060015/]
- 67. Electrical stimulation: a missing key to promote maturation ... [https://pmc.ncbi.nlm.nih.gov/articles/PMC12547514/]
- 68. Simultaneous electro-dynamic stimulation accelerates ... [https://www.sciencedirect.com/science/article/pii/S0006291X24011410]
- 69. Generation and purification of iPSC-derived cardiomyocytes ... [https://stemcellres.biomedcentral.com/articles/10.1186/s13287-025-04319-0]
- 70. Metabolic Maturation in hiPSC-Derived Cardiomyocytes [https://pmc.ncbi.nlm.nih.gov/articles/PMC12389403/]
- 71. Characterization of cardiac metabolism in iPSC-derived ... [https://pmc.ncbi.nlm.nih.gov/articles/PMC9308297/]
- 72. Maturation of pluripotent stem cell-derived cardiomyocytes [https://stemcellres.biomedcentral.com/articles/10.1186/s13287-024-03961-4]
- 73. Metabolic Maturation Media Improve Physiological Function of ... [https://pmc.ncbi.nlm.nih.gov/articles/PMC7437654/]
- 74. Substrate stiffness-dependent metabolic reprogramming of ... [https://www.sciencedirect.com/science/article/pii/S2214030125000100]
- 75. Metabolic Maturation Media Improve Physiological ... [https://www.sciencedirect.com/science/article/pii/S2211124720309062]
- 76. Cellular heterogeneity of pluripotent stem cell-derived ... [https://pmc.ncbi.nlm.nih.gov/articles/PMC11358004/]
- 77. Enhancing human pluripotent stem cell differentiation to ... [https://www.sciencedirect.com/science/article/pii/S2589004225007138]
- 78. Dual-Cardiotoxicity Evaluation of Torsadogenic Risk Drugs ... [https://www.sciencedirect.com/science/article/pii/S0006291X2501472X]
- 79. Optical mapping of the interface between iPSC-derived ... [https://pmc.ncbi.nlm.nih.gov/articles/PMC12583502/]
- 80. Strategies to improve the therapeutic effect of pluripotent ... [https://pmc.ncbi.nlm.nih.gov/articles/PMC9388750/]
- 81. Optimizing the Use of iPSC-CMs for Cardiac Regeneration ... [https://www.mdpi.com/2076-2615/10/9/1561]
- 82. Induced Pluripotent Stem Cells in Cardiomyopathy: Advancing Disease Modeling, Therapeutic Development, and Regenerative Therapy [https://www.mdpi.com/1422-0067/26/11/4984]
- 83. Model Systems for Addressing Mechanism of ... [https://pmc.ncbi.nlm.nih.gov/articles/PMC8164614/]
- 84. Animal and cellular models of atrial fibrillation: a review [https://www.frontiersin.org/journals/cardiovascular-medicine/articles/10.3389/fcvm.2025.1617652/full]
- 85. Comparing the signaling and transcriptome profiling landscapes of human iPSC-derived and primary rat neonatal cardiomyocytes - PMC [https://pmc.ncbi.nlm.nih.gov/articles/PMC10382583/]
- 86. Bridging the Translational Gap in Heart Failure Research: Using Human iPSC-derived Cardiomyocytes to Accelerate Therapeutic Insights - PMC [https://pmc.ncbi.nlm.nih.gov/articles/PMC10655754/]
- 87. Use of Patient Health Records to Quantify Drug-Related ... [https://pmc.ncbi.nlm.nih.gov/articles/PMC7659582/]
- 88. Graft–host coupling changes can lead to engraftment ... [https://pmc.ncbi.nlm.nih.gov/articles/PMC10901678/]
- 89. Processing and analysis of cardiac optical mapping data ... [https://pmc.ncbi.nlm.nih.gov/articles/PMC3469699/]
- 90. High resolution optical mapping of cardiac ... [https://www.nature.com/articles/s41597-022-01253-1]
- 91. Wavelet analysis of cardiac optical mapping data [https://www.sciencedirect.com/science/article/abs/pii/S0010482515002401]
- 92. Novel Molecular Vehicle-Based Approach for Cardiac Cell ... [https://www.mdpi.com/1422-0067/24/12/10406]
- 93. FDA Announces Plan to Phase Out Animal Testing ... [https://www.fda.gov/news-events/press-announcements/fda-announces-plan-phase-out-animal-testing-requirement-monoclonal-antibodies-and-other-drugs]
- 94. New Approach Methodologies (NAMs) in Drug Development [https://www.thermofisher.com/blog/biotechnology/new-approach-methodologies-nams-in-drug-development/]
- 95. New Approach Methodologies (NAMs): Advances in ... [https://www.axionbiosystems.com/new-approach-methodologies-nams-advances-preclinical-safety-studies]
- 96. Are Animals Out? How NAMs Are Changing the Rules of ... [https://www.biospace.com/fda/are-animals-out-how-nams-are-changing-the-rules-of-the-game]
- 97. Regulatory strategy reimagined: Three trends accelerating ... [https://www.drugdiscoverytrends.com/regulatory-strategy-reimagined-three-trends-accelerating-drug-development/]
- 98. Comprehensive promotion of iPSC - CM maturation by integrating... [https://pmc.ncbi.nlm.nih.gov/articles/PMC11928738/]
- 99. Human induced pluripotent stem cell-derived closed-loop ... [https://pmc.ncbi.nlm.nih.gov/articles/PMC10850789/]
- 100. Comparative analysis of the cardiomyocyte differentiation ... [https://pmc.ncbi.nlm.nih.gov/articles/PMC9950567/]