Potency by Design: A GMP-Compliant Roadmap for MSC Assay Development in Cell Therapy
This article provides a comprehensive guide for researchers, scientists, and drug development professionals on establishing robust, Good Manufacturing Practice (GMP)-compliant potency assays for Mesenchymal Stromal/Stem Cells (MSCs).
Potency by Design: A GMP-Compliant Roadmap for MSC Assay Development in Cell Therapy
Abstract
This article provides a comprehensive guide for researchers, scientists, and drug development professionals on establishing robust, Good Manufacturing Practice (GMP)-compliant potency assays for Mesenchymal Stromal/Stem Cells (MSCs). It covers the foundational principles of potency as a critical quality attribute, explores diverse methodological approaches (functional, biomarker-based, omics), addresses common challenges in standardization and optimization, and outlines rigorous validation frameworks aligned with regulatory expectations (FDA, EMA, ICH Q2(R2)). The content synthesizes current best practices to bridge the gap between research-grade characterization and clinical lot release testing, ensuring MSCs' therapeutic promise is reliably measured and controlled.
Understanding Potency: The Cornerstone of MSC Identity and Function for GMP
Potency in Mesenchymal Stromal Cell (MSC) therapies is a critical quality attribute required for Good Manufacturing Practice (GMP) release. It must measure the biological function linked to the clinical Mechanism of Action (MoA), moving far beyond simple viability or cell surface marker characterization. This technical support center addresses common experimental challenges in developing robust, GMP-compliant potency assays.
Troubleshooting Guides & FAQs
FAQ Section 1: Assay Design & Validation
Q1: Our immunomodulation assay shows high donor-to-donor variability in MSC samples. How can we improve reproducibility? A: High variability often stems from inconsistent responder immune cell populations or assay conditions.
- Troubleshooting Steps:
- Standardize Effector Cells: Use cryopreserved, qualified batches of peripheral blood mononuclear cells (PBMCs) from a single donor for screening assays, or a pool of 3-5 donors for final validation.
- Implement a Reference Standard: Include a well-characterized, stable MSC reference material (e.g., from NIST or internally developed) in every assay run to normalize data.
- Control Activation: Pre-treat PBMCs with a mitogen like PHA or anti-CD3/CD28 beads at a standardized, sub-maximal concentration.
- Optimize Co-culture Ratio: Titrate the MSC:PBMC ratio (e.g., 1:5 to 1:20) to find the linear range of suppression for your specific MSC type.
Q2: Our trilineage differentiation potency assay is inconsistent, with high background in control wells. A: This indicates suboptimal differentiation media or cell health issues.
- Troubleshooting Steps:
- Verify Reagent Quality: Use fresh, aliquoted induction supplements (e.g., dexamethasone, IBMX, ascorbate-2-phosphate). Prepare new differentiation media immediately before use.
- Optimize Seeding Density: Critical for confluence-induced differentiation. Standardize density (e.g., 21,000 cells/cm² for adipogenesis).
- Include Strict Controls: Use both a proven positive control (MSCs known to differentiate) and inhibitor controls (e.g., Runx2/Cbfa-1 inhibitor for osteogenesis).
- Quantify Outputs: Move from subjective microscopy to quantitative reads (e.g., Alizarin Red S extraction with cetylpyridinium chloride for osteogenesis, measured at 562nm).
FAQ Section 2: Technical & Analytical Challenges
Q3: Our qPCR data for potency-relevant genes (e.g., IDO1, TSG-6) is noisy and not statistically significant. A: This is common due to low basal expression and induction dynamics.
- Troubleshooting Protocol:
- Proper Induction: Stimulate MSCs with relevant cytokines (e.g., 20ng/mL IFN-γ + 10ng/mL TNF-α) for 6-24 hours before RNA harvest.
- RNA Integrity: Ensure RIN > 8.5. Use a spin-column based purification method.
- Gene Selection: Include early (IDO1), mid (COX-2), and late (TSG-6) response genes. Use ≥3 reference genes (e.g., YWHAZ, B2M, HPRT1) validated via NormFinder or geNorm.
- Analysis: Use the ΔΔCq method with efficiency correction. Run samples in triplicate (technical) from ≥3 biological replicates.
Q4: The phospho-flow cytometry data for signaling pathways (e.g., p-STAT) is inconsistent between runs. A: Phospho-epitopes are labile and timing is critical.
- Step-by-Step Fix:
- Rapid Fixation: After stimulation, immediately add an equal volume of pre-warmed (37°C) 2X Fixation Buffer (e.g., BD Phosflow Lyse/Fix) directly to culture well. Mix gently. Incubate 10 min at 37°C.
- Permeabilization: Use ice-cold 100% methanol for permeabilization. Store fixed cells in methanol at -80°C for up to 3 weeks for batch analysis.
- Antibody Titration: Titrate all phospho-specific antibodies on stimulated and unstimulated cells to determine optimal signal-to-noise.
- Use a Bead Standard: Include phospho-protein calibration beads (e.g., BD Quantibrite Beads) to standardize MFI values across experiments.
Experimental Protocols
Protocol 1: Quantitative Immunomodulation Potency Assay (PBMC Proliferation)
- Purpose: To measure MSC-mediated suppression of T-cell proliferation.
- Materials: MSCs (test and reference), PBMCs from qualified donor(s), RPMI-1640+10% FBS, anti-CD3/CD28 activation beads, CFSE dye, flow cytometer.
- Method:
- Label PBMCs: Resuspend PBMCs at 10x10⁶/mL in PBS+0.1% BSA. Add CFSE to final 1µM. Incubate 10 min at 37°C. Quench with 5x volume of ice-cold complete media. Wash twice.
- Set Up Co-culture: Plate irradiated (30-50 Gy) MSCs in a 96-well U-bottom plate. Add CFSE-labeled PBMCs at a 1:10 (MSC:PBMC) ratio. Include PBMC-only (max proliferation) and unstimulated PBMC (background) controls.
- Activate: Add anti-CD3/CD28 beads at a 1:1 bead:PBMC ratio.
- Incubate: Culture for 5 days at 37°C, 5% CO₂.
- Analyze: Harvest cells, stain for CD3+ T-cells, and analyze CFSE dilution via flow cytometry. Calculate % suppression:
[1 - (%Dividing T-cells in Co-culture / %Dividing T-cells in PBMC-only control)] x 100.
Protocol 2: Secretome Analysis via Multiplex ELISA
- Purpose: To quantify a panel of soluble mediators (MoA-relevant) secreted by MSCs.
- Materials: Conditioned media from MSC cultures (stimulated/unstimulated), multiplex assay kit (e.g., Luminex, MSD), plate shaker, multiplex reader.
- Method:
- Generate Conditioned Media: Plate MSCs at 5,000 cells/cm². At 80% confluence, replace media with serum-free basal media ± IFN-γ (20ng/mL). Collect supernatant after 24h. Centrifuge to remove debris. Aliquot and store at -80°C.
- Assay Run: Thaw samples on ice. Follow manufacturer's protocol for the selected multiplex panel (e.g., IL-6, IL-8, VEGF, HGF, PGE2, IDO). Run samples in duplicate.
- Data Reduction: Use a 5-parameter logistic (5PL) curve fit for each analyte. Report concentrations in pg/mL/10⁶ cells/24h.
Data Presentation
Table 1: Key Potency Assay Correlates for Common MSC MoAs
| Proposed Mechanism of Action (MoA) | Recommended Potency Assay Format | Quantitative Readout | Typical Target Range/Threshold |
|---|---|---|---|
| Immunomodulation (e.g., GvHD, Crohn's) | Inhibition of PBMC/PHA-driven proliferation | % Suppression of T-cell division (CFSE) | >40% suppression at 1:10 (MSC:PBMC) ratio |
| Induction of Immunosuppressive Factors | IDO activity (Kynurenine/Trp ratio via HPLC) or PGE2 (pg/mL via ELISA) | >50% Tryptophan depletion; PGE2 > 1000 pg/mL/10⁶ cells/24h | |
| Angiogenesis (e.g., CLI, MI) | Endothelial Tube Formation Assay | Total tube length (pixels) or branch points in co-culture | >2-fold increase vs. negative control |
| Secretion of Pro-angiogenic Factors | VEGF, HGF (pg/mL via Multiplex) | VEGF > 500 pg/mL/10⁶ cells/24h | |
| Anti-fibrosis/Tissue Repair | Inhibition of TGF-β1-induced Fibroblast Activation | % Reduction in α-SMA+ fibroblasts or Collagen I secretion | >30% reduction in α-SMA expression |
Table 2: Comparison of Potency Assay Platforms
| Platform | Measured Output | Advantages | Challenges for GMP |
|---|---|---|---|
| Cell-based Bioassay (e.g., PBMC suppression) | Functional biological response | Most relevant to MoA; integrative | High variability; long duration (5-7 days) |
| Biochemical (e.g., ELISA/MSD) | Specific secreted protein(s) | Quantitative, precise, high-throughput | May not capture integrated function |
| Molecular (e.g., qPCR, Nanostring) | Gene expression signature | High-plex, mechanistic insight | Requires correlation to functional output |
| Flow Cytometry (e.g., phospho-flow, surface markers) | Protein expression/phosphorylation at single-cell level | High-content, multi-parameter | Complex validation; sample stability |
Visualizations
Title: MSC Immunomodulation via IDO1 and PGE2 Pathway
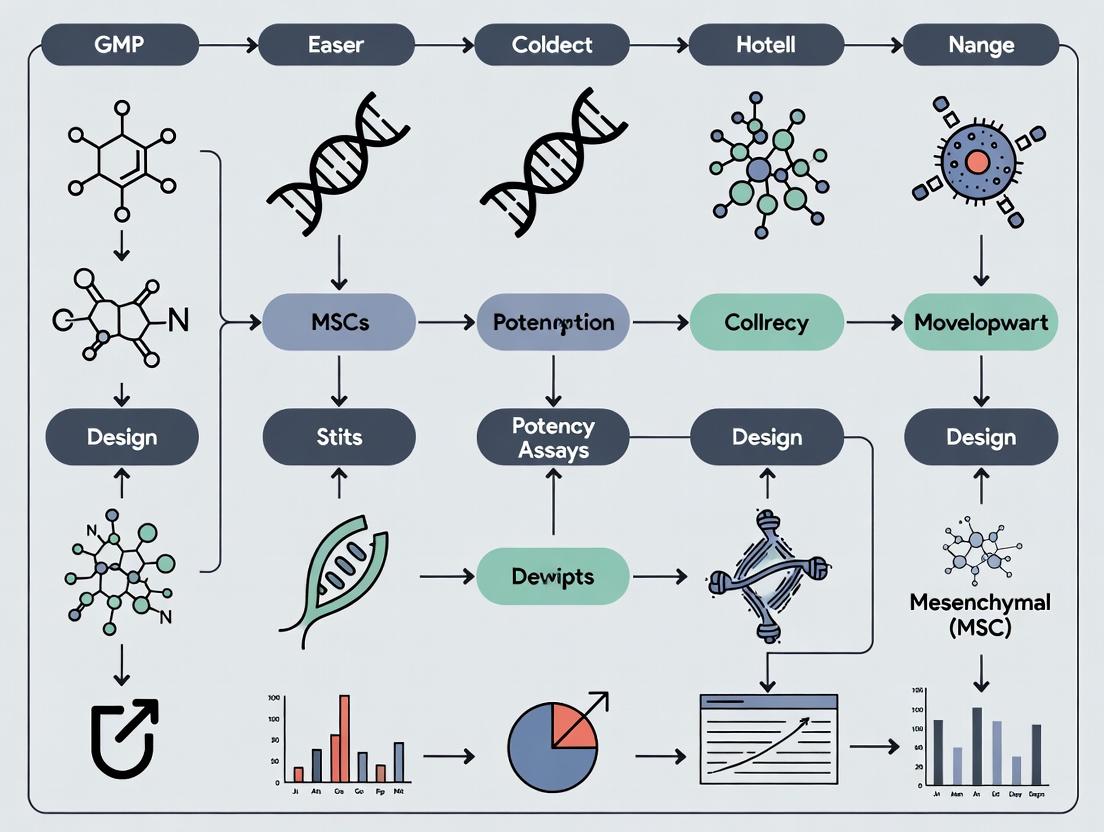
Title: GMP Potency Assay Development Workflow
The Scientist's Toolkit: Research Reagent Solutions
| Item | Function in MSC Potency Testing | Example/Note |
|---|---|---|
| Recombinant Human IFN-γ & TNF-α | To stimulate MSCs to induce expression of immunomodulatory genes (IDO1, COX-2). | Use GMP-grade for late-stage development. Titrate for consistent induction. |
| Anti-human CD3/CD28 Activator Beads | To provide a standardized, strong polyclonal activation of T-cells in co-culture suppression assays. | Preferred over PHA for consistency. Ratio of beads:PBMC is critical. |
| CFSE Cell Division Tracker | A fluorescent dye diluted upon cell division to quantify T-cell proliferation by flow cytometry. | Superior to ³H-thymidine incorporation. Optimize concentration to avoid toxicity. |
| Luminex/Multiplex ELISA Panels | To simultaneously quantify multiple MSC-secreted factors (VEGF, HGF, IL-6, PGE2, etc.) from small sample volumes. | Validated, pre-configured panels save time. MSD platform offers high sensitivity. |
| Validated qPCR Assays & Reference Genes | To measure potency-relevant gene expression signatures. Requires stable reference genes for normalization. | Pre-designed, wet-lab validated assays (e.g., from ThermoFisher's TaqMan portfolio) ensure reproducibility. |
| Phospho-Protein Stabilization Buffers | To rapidly fix cells for intracellular signaling analysis (e.g., p-STAT1, p-p38) without altering epitopes. | Commercial kits (e.g., BD Phosflow) are essential for consistent phospho-flow results. |
| Qualified MSC Reference Standard | A stable, well-characterized MSC batch used to normalize potency data across experiments and time. | Can be developed internally or sourced from cell banks (e.g., ATCC). Essential for GMP. |
Troubleshooting Guides & FAQs
FAQ 1: Why is a potency assay mandatory for my MSC IND submission, and what are the core regulatory expectations? A potency assay is a direct measure of the biological activity of your MSC product, which is linked to its intended mechanism of action (MoA). The FDA (21 CFR 600.3(s)) and EMA (Guideline on potency testing of cell-based immunotherapy) mandate it as a critical quality attribute (CQA). It is non-negotiable because it ensures batch-to-batch consistency, product stability, and ultimately, that the product will have the intended clinical effect. Without a validated potency assay, regulators cannot assess whether your product is suitable for clinical trials.
FAQ 2: Our MSC proliferation assay shows high variability. How can we improve robustness for GMP compliance? High variability often stems from inconsistent cell seeding, edge effects in plates, or serum lot differences. Troubleshooting Guide:
- Problem: High CV (>20%) between replicate wells.
- Solution: Implement a pre-plating cell viability and count normalization protocol using an automated cell counter with dye exclusion. Use master mixes for all reagents.
- Problem: Edge effect (evaporation) causing outer well anomalies.
- Solution: Use tissue culture-treated plates with a uniform surface. Fill perimeter wells with PBS only and use only interior wells for assays. Consider using humidity chambers during incubation.
- Problem: Inconsistent readout from colorimetric assays (e.g., MTT).
- Solution: Switch to a more robust, fluorescence-based assay (e.g., AlamarBlue, CFSE dilution by flow cytometry) and validate against the colorimetric method. Ensure plate reader calibration.
FAQ 3: We are developing an immunomodulatory potency assay based on T-cell suppression. What are the key controls, and how do we address donor-derived variability? This functional assay is common for MSCs with an immunomodulatory MoA. Key controls are essential. Troubleshooting Guide:
- Problem: High background T-cell proliferation in suppression assays.
- Solution: Include a "T-cell Only + Mitogen" maximum proliferation control and a "T-cell Only, No Mitogen" baseline control. Ensure your MSC irradiation or mitomycin-C treatment is complete to prevent confounding proliferation.
- Problem: Variable suppression potency due to responder T-cell donor.
- Solution: Use a qualified pool of cryopreserved PBMCs from 3-5 donors as the responder source. This averages out donor-specific effects. Include a reference MSC batch as an inter-assay control to normalize results between runs.
- Problem: How to quantify suppression accurately.
- Solution: Use flow cytometry-based quantification of proliferating T-cells (e.g., Ki-67, CFSE dilution) over tritiated thymidine incorporation. Calculate % suppression:
[1 - (T-cell+MSC+Mitogen count / T-cell+Mitogen count)] * 100.
- Solution: Use flow cytometry-based quantification of proliferating T-cells (e.g., Ki-67, CFSE dilution) over tritiated thymidine incorporation. Calculate % suppression:
FAQ 4: How do we bridge research-grade potency assays to ones suitable for a GMP-compliant QC environment? The transition requires a focus on validation, standardization, and control. Troubleshooting Guide:
- Problem: Research assay uses research-grade (non-GMP) reagents.
- Solution: Initiate a reagent bridging study. Qualify GMP-grade or equivalent Animal Origin-Free (AOF) reagents (e.g., cytokines, FBS alternatives). Compare performance data between old and new reagents in a side-by-side assay to demonstrate equivalence.
- Problem: Assay protocol has subjective endpoints (e.g., visual colony counting).
- Solution: Implement automated, quantitative endpoints. Replace manual colony counting with an automated image analysis system for CFU assays. Replace ELISA with an electrochemiluminescence (ECL) platform for cytokine secretion assays for wider dynamic range.
- Problem: No established assay or system suitability controls.
- Solution: Develop and fully characterize a potency assay reference standard (e.g., a master cell bank aliquot) with an assigned target value and range. This standard must be used in every run to confirm the assay is performing as expected.
Experimental Protocols
Protocol 1: GMP-Compliant T-Cell Suppression Assay for MSC Potency
Objective: To quantitatively measure the in vitro immunosuppressive capacity of MSCs as a potency assay. Methodology:
- PBMC Isolation & Preparation: Isolate PBMCs from qualified leukapheresis packs using density gradient centrifugation. Pool cells from multiple donors, aliquot, and cryopreserve in vapor-phase liquid nitrogen. Pre-qualify the pool for consistent responsiveness to mitogen.
- MSC Preparation: Harvest test and reference MSCs at target passage. Irradiate cells (e.g., 30 Gy) to inhibit MSC proliferation. Detach, count, and suspend in assay medium (X-VIVO 15, 5% human platelet lysate).
- Co-culture Setup: In a 96-well round-bottom plate, seed irradiated MSCs at three densities (e.g., 1:10, 1:50, 1:250 MSC:PBMC ratio) in triplicate. Add 2e5 PBMCs per well. Stimulate T-cells with CD3/CD28 activator beads per manufacturer's instructions. Include controls: PBMCs + beads (Max Proliferation), PBMCs alone (Baseline), MSCs alone (Background).
- Incubation & Measurement: Incubate for 5 days at 37°C, 5% CO2. On day 5, add a fluorescent proliferation dye (e.g., CellTrace Violet) according to kit instructions, then analyze by flow cytometry. Alternatively, quantify secreted IFN-γ or IL-10 via a validated ECL immunoassay.
- Data Analysis: Gate on live lymphocytes > CD3+ T-cells. Determine the percentage of proliferating (dye-low) cells in each condition. Calculate % suppression for each test article relative to the Max Proliferation control.
Protocol 2: Quantitative Trophic Factor Secretion Assay (ELISA to ECL Bridging)
Objective: To transition from research ELISA to a GMP-suitable, quantitative potency assay for MSC-secreted factors (e.g., HGF, VEGF). Methodology:
- Standard Curve & QC Preparation: Reconstitute WHO International Standards or certified reference standards for target analytes. Prepare a 5-point standard curve in assay diluent. Include two levels of QC samples (low, high) from a characterized MSC-conditioned medium pool.
- Sample Preparation: Culture test MSCs (e.g., 10,000 cells/cm²) in serum-free medium for 48h. Collect conditioned medium, centrifuge to remove debris, and store at -80°C. Thaw and dilute samples to fall within the standard curve range.
- Assay Execution:
- Research ELISA: Perform per kit manual. Use a calibrated plate reader.
- Bridging to GMP ECL: Use a validated multiplex ECL panel (e.g., Meso Scale Discovery). Add standards, QCs, and samples to the pre-coated plate. Follow manufacturer's protocol for detection. Read on an MSD or similar SQ120 imager.
- Validation Parameters: For the GMP method, establish precision (intra/inter-assay %CV), accuracy (% recovery of spiked analyte), linearity, and robustness. The bridging study must show a correlation coefficient (r) >0.95 between ELISA and ECL results for the same sample set.
Data Presentation
Table 1: FDA vs. EMA Key Requirements for Potency Assays in Submissions
| Aspect | FDA Guidance (CBER Guidance for Industry: Potency Tests for Cellular and Gene Therapy Products) | EMA Guideline (Potency Testing of Cell-based Immunotherapy Medicinal Products) |
|---|---|---|
| Definition | The specific ability or capacity of the product to achieve its defined biological effect. | A measure of the biological activity of a product, linked to its relevant biological properties. |
| Timing for IND | Required for Phase 1, though may be iterative. "The potency assay should be in place by the initiation of Phase 3 studies." | Required from clinical trial application (CTA). The assay should be "validated" for marketing authorization application (MAA). |
| Assay Attributes | Should be quantitative, measure biological function, and demonstrate stability-indicating capability. | Should reflect the proposed mechanism of action, be quantitative where possible, and be stability-indicating. |
| Multiple Assays | May be acceptable if a single assay cannot represent the complete mechanism of action. | A matrix of tests (composite assay) is acceptable for complex products with multiple functions. |
| Validation Parameter | Acceptance Criterion | Observed Result | Conclusion |
|---|---|---|---|
| Specificity | No suppression in absence of MSCs or with non-functional (heat-inactivated) MSCs. | <5% suppression in negative control wells. | Pass |
| Accuracy/Recovery | 70-130% recovery of reference standard potency. | 98% recovery (Range: 89-107%). | Pass |
| Precision (Repeatability) | Intra-assay %CV ≤ 15% for replicates. | %CV = 8.2% (n=12). | Pass |
| Intermediate Precision | Inter-assay, inter-analyst %CV ≤ 20%. | %CV = 16.5% (n=18, over 3 analysts). | Pass |
| Linearity & Range | R² ≥ 0.95 across specified cell ratio range. | R² = 0.98 across 1:5 to 1:500 MSC:PBMC ratio. | Pass |
| Robustness | Deliberate minor changes do not significantly alter result. | CV <5% for planned small changes in incubation time (±2h). | Pass |
Mandatory Visualization
MSC Potency Assay Development GMP Workflow
MSC Immunomodulatory Mechanism for Assay Design
The Scientist's Toolkit: Research Reagent Solutions
| Item | Function & GMP Consideration |
|---|---|
| Defined, Xeno-Free (AOF) Culture Medium | Provides consistent, animal-origin-free nutrients for MSC expansion, reducing immunogenicity risks and lot variability. Essential for GMP manufacturing. |
| Human Platelet Lysate (hPL) / Defined Growth Factors | Serum replacement providing essential growth factors for MSC proliferation. GMP-grade, pathogen-inactivated hPL is critical for regulatory compliance. |
| Cell Dissociation Reagent (e.g., recombinant trypsin) | For gentle, consistent cell harvesting. GMP-grade, animal-origin-free enzymes ensure process consistency and reduce contaminant risk. |
| Flow Cytometry Antibody Panel (CD73, CD90, CD105, CD45, HLA-DR) | For identity/purity testing. Use GMP-compatible, fluorochrome-conjugated antibodies that are validated for consistency and specificity. |
| Lymphocyte Activation Reagents (CD3/CD28 beads) | To provide a standardized, potent stimulus for T-cells in suppression assays. Use clinical-grade or well-characterized reagents for lot-to-lot consistency. |
| Quantitative Cytokine Detection Kit (ECL Platform) | For measuring MSC-secreted trophic factors or immune modulators (VEGF, HGF, PGE2, IDO). ECL offers superior sensitivity, dynamic range, and multiplexing for GMP assays over ELISA. |
| Reference Standard & Potency Assay Controls | A fully characterized MSC bank or analyte standard with assigned potency units. Non-negotiable for assay calibration, system suitability, and demonstrating stability. |
| Viability/Proliferation Dyes (e.g., CellTrace Violet, AlamarBlue) | For quantitative, fluorescence-based measurement of cell proliferation in potency assays. Preferred over colorimetric MTT for precision and linearity. |
Troubleshooting Guides & FAQs
Q1: Our MSC potency assay for immunomodulation (e.g., T-cell suppression) shows high donor-to-donor variability. How can we standardize it? A: High variability often stems from inconsistent MSC seeding density or responder immune cell health. Ensure MSCs are seeded at a consistent, optimized confluency (e.g., 70-80%) 24 hours prior to the assay. Use cryopreserved, qualified batches of peripheral blood mononuclear cells (PBMCs) from a single donor for assay development to minimize immune cell variability. Always include a reference MSC batch with known potency as an internal control.
Q2: In the IDO activity assay (trophic/immunomodulatory mechanism), the colorimetric readout is inconsistent between replicates. What are potential causes? A: Inconsistent IDO (Indoleamine 2,3-dioxygenase) activity readouts are commonly due to:
- Interfering Media Components: Fetal bovine serum (FBS) contains kynurenine. Use serum-free media during the induction and assay period.
- Inadequate IFN-γ Stimulation: Titrate the IFN-γ concentration and verify its activity. A typical optimized protocol is detailed below.
- Plate Reader Issues: Ensure the plate is protected from light during development and read kinetically if possible.
Q3: When testing differentiation potency (osteogenic/adipogenic), the control wells (maintenance media) are also showing some staining. Is this normal? A: Minimal background staining can occur, but robust staining should be mechanism-specific. This indicates potential:
- Serum Lot Variability: Some FBS lots have high differentiation-inducing factors. Use a dedicated, screened lot for differentiation assays.
- Cell Overconfluence: MSCs at very high confluence may spontaneously differentiate. Seed at a low, defined density (e.g., 3,000 cells/cm²).
- Incomplete Media Removal: Thoroughly wash cells before adding induction media to remove all growth factors.
Q4: Our cytokine secretion profile (trophic mechanism) from MSCs stimulated with inflammatory cues does not correlate with in vivo efficacy. What parameters should we re-examine? A: The in vitro inflammatory microenvironment may not mirror the in vivo niche. Key factors to optimize:
- Stimulus Cocktail: Use a combination of cytokines (e.g., IFN-γ + TNF-α) at physiologically relevant concentrations.
- Time Point: Secretion is dynamic. Perform a time-course (e.g., 6, 24, 48, 72h) to capture the peak release of your key analytes (e.g., PGE2, TSG-6, HGF).
- 3D Culture: Consider transitioning to spheroid or hydrogel-based culture, which can more accurately mimic the secretome profile in vivo.
Experimental Protocols
Protocol 1: GMP-Compliant T-Cell Suppression Assay Purpose: Quantify MSC potency via inhibition of activated T-cell proliferation. Method:
- Plate gamma-irradiated MSCs in triplicate in a 96-well plate at 5x10³, 1x10⁴, and 2x10⁴ cells/well.
- After 24h, activate CFSE-labeled human PBMCs (2x10⁵/well) with soluble anti-CD3/CD28 antibodies.
- Co-culture activated PBMCs with the pre-seeded MSCs for 5 days.
- Harvest non-adherent cells and analyze CFSE dilution via flow cytometry.
- Potency Calculation: Calculate % suppression relative to PBMC-only controls. Report the MSC:PBMC ratio required for 50% suppression (IC₅₀).
Protocol 2: Quantitative IDO Activity Assay Purpose: Measure functional IDO enzyme activity as a key immunomodulatory/trophic potency marker. Method:
- Plate MSCs in a 96-well plate at 2x10⁴ cells/well. Incubate overnight.
- Replace media with serum-free medium containing 100 ng/mL IFN-γ. Incubate for 48h.
- Add L-Tryptophan (final 400 µM) to each well. Incubate for 4h.
- Collect supernatant and mix with 30% (w/v) Trichloroacetic acid. Centrifuge.
- Transfer supernatant to a new plate, mix with Ehrlich’s reagent (p-dimethylaminobenzaldehyde), and incubate 10min at RT protected from light.
- Measure absorbance at 492 nm. Calculate kynurenine concentration from a standard curve.
Protocol 3: Multiplex Cytokine Secretion Profiling Purpose: Characterize the trophic factor secretome potency under inflammatory priming. Method:
- Seed MSCs in a 24-well plate at 5x10⁴ cells/well. Incubate to 80% confluence.
- Prime cells with serum-free medium containing 50 ng/mL IFN-γ + 20 ng/mL TNF-α for 24h.
- Collect conditioned media, centrifuge to remove debris, and store at -80°C.
- Analyze samples using a validated, GMP-compatible multiplex Luminex or ELISA array for PGE2, VEGF, HGF, IL-6, IL-8, and TSG-6.
- Normalize cytokine concentrations to total cell protein or cell number.
Data Presentation
Table 1: Comparative Potency Assay Metrics for Proposed MSC Mechanisms
| Proposed Mechanism | Key Functional Assay | Quantifiable Readout | Typical Assay Duration | Critical Quality Attributes (CQA) to Monitor |
|---|---|---|---|---|
| Immunomodulation | T-cell Proliferation Suppression | % Suppression; IC₅₀ (MSC:PBMC ratio) | 5-7 days | Donor PBMC viability, MSC seeding uniformity, cytokine (IFN-γ) activity |
| Trophic Support | Paracrine Factor Secretion Profile | Concentration (pg/mL/µg protein) of PGE2, VEGF, HGF, etc. | 24-72h | Priming stimulus consistency, serum-free conditions, analyte stability |
| Differentiation | Trilineage Differentiation (ISCT minimum criteria) | Quantification of calcium (Osteo), lipid droplets (Adipo), GAGs (Chondro) | 14-21 days | Media component stability, inducer lot consistency, quantitative image analysis |
Table 2: Example Potency Data for Reference MSC Batch (Donor 123)
| Assay Type | Stimulus/Condition | Readout | Result (Mean ± SD) | Specification for Release |
|---|---|---|---|---|
| T-cell Suppression | PBMC : MSC = 10:1 | % Suppression | 72.5% ± 4.2% | ≥ 60% Suppression |
| IDO Activity | 100 ng/mL IFN-γ | [Kynurenine] µM/10⁶ cells/4h | 45.3 ± 5.1 µM | ≥ 30 µM |
| Secretome (PGE2) | 50 ng/mL IFN-γ + 20 ng/mL TNF-α | Secreted PGE2 (ng/10⁶ cells/24h) | 8.9 ± 1.2 ng | ≥ 5.0 ng |
Diagrams
MSC Potency Mechanism & Assay Pathway
GMP Potency Assay Development Workflow
The Scientist's Toolkit: Research Reagent Solutions
| Item | Function in Potency Assay Development |
|---|---|
| GMP-Grade IFN-γ & TNF-α | Defined, low-endotoxin cytokines for reproducible inflammatory priming of MSCs to activate mechanism-specific pathways. |
| Qualified FBS/Low-Human Platelet Lysate (hPL) | Consistent, lot-tested growth supplement essential for maintaining MSC phenotype and ensuring reproducible baseline function. |
| CD3/CD28 T-Cell Activator | Standardized reagent for consistent, robust activation of responder T-cells in immunosuppression assays. |
| Defined Differentiation Inducers | Lot-controlled, specific cocktails (e.g., dexamethasone, IBMX, ascorbate-2-phosphate) for reliable trilineage differentiation. |
| Multiplex Immunoassay Panels | Validated panels (e.g., Luminex) for simultaneous quantification of multiple trophic/immunomodulatory factors from small sample volumes. |
| Flow Cytometry Antibody Panels (e.g., ISCT minimal) | Antibodies against CD73, CD90, CD105, CD45, CD34, HLA-DR for confirming MSC identity prior to potency testing. |
| Reference MSC Batch | A well-characterized, cryopreserved MSC batch with known in vivo efficacy, serving as an internal control for all potency assays. |
Technical Support Center
Troubleshooting Guides & FAQs
FAQ 1: How do I define Critical Quality Attributes (CQAs) for my MSC-based therapy?
- Answer: CQAs are physical, chemical, biological, or microbiological properties that must be within an appropriate limit, range, or distribution to ensure the desired product quality, safety, and efficacy. For MSCs, CQAs are directly linked to the mechanism of action (MoA). Begin by mapping your proposed MoA (e.g., immunomodulation via IDO secretion, tissue repair via VEGF secretion) to measurable product attributes. Key categories include:
- Identity/Purity: Surface marker expression (e.g., CD73+, CD90+, CD105+, CD45-), absence of contaminants.
- Potency: Quantitative measure of biological activity (e.g., cytokine secretion rate, inhibition of T-cell proliferation, angiogenic potential).
- Viability: Cell viability and metabolic activity post-thaw.
- Safety: Microbiological sterility, endotoxin levels, tumorigenicity potential.
FAQ 2: My potency assay shows high variability. How can I improve robustness for GMP compliance?
- Answer: High variability often stems from inconsistent cell handling, reagent lots, or assay endpoints. Implement these steps:
- Standardize Pre-Assay Conditions: Use a defined passage number, ensure identical culture confluence at harvest, and implement a standardized thawing protocol.
- Use Qualified Reagents: Source critical reagents (e.g., growth factors, target cells like PBMCs for immunomodulation assays) from reliable vendors and establish qualification protocols for new lots.
- Incorporate Controls: Include a reference standard (e.g., a master cell bank aliquot) and both positive and negative controls in every assay run.
- Define Acceptance Criteria: Establish statistically sound assay validity criteria (e.g., reference standard must fall within a pre-defined potency range, negative control response must be below X%).
- Perform a Formal Assay Qualification: Document accuracy, precision (repeatability & intermediate precision), linearity, range, and specificity per ICH Q2(R1) guidelines.
FAQ 3: Which signaling pathways should I measure to capture MSC immunomodulatory potency?
- Answer: Focus on pathways activated in MSCs upon inflammatory priming (e.g., with IFN-γ and TNF-α) that lead to effector molecule secretion. The primary pathways are:
- JAK-STAT Pathway: IFN-γ binding activates JAK1/JAK2, phosphorylating STAT1, leading to transcription of IDO1.
- NF-κB Pathway: TNF-α binding activates IKK, leading to IκB degradation and nuclear translocation of NF-κB (p65/p50), driving transcription of COX-2/PGE2 and additional inflammatory modulators.
Diagram Title: Key Immunomodulatory Pathways in Primed MSCs
FAQ 4: How do I develop a matrix of assays to cover multiple mechanisms of action?
- Answer: A potency assay matrix uses complementary in vitro assays to capture the complexity of MSC function. Below is a protocol and a summary table of a multi-assay approach.
Experimental Protocol: T-Cell Proliferation Inhibition Assay (Key Potency Assay)
- Priming: Seed MSCs at 80% confluence. Add priming cocktail (e.g., 50 ng/mL IFN-γ + 20 ng/mL TNF-α) for 24-48 hours.
- Co-culture Setup: Harvest primed MSCs and seed into a 96-well plate. Allow to adhere. Isolate PBMCs from donor blood using density gradient centrifugation.
- T-Cell Activation: Label PBMCs with CFSE (5 μM, 10 min, quench with serum). Add activated PBMCs (stimulated with CD3/CD28 beads or PHA) to the MSC monolayer. Use an MSC:PBMC ratio optimized for your cell type (e.g., 1:10).
- Incubation: Co-culture for 3-5 days in a humidified incubator (37°C, 5% CO2).
- Analysis: Harvest non-adherent cells. Analyze CFSE dilution by flow cytometry to determine percentage of proliferated CD3+ T-cells. Compare to PBMCs alone (positive control) and unprimed MSCs.
- Quantification: Calculate % inhibition:
[1 - (% Proliferation with MSCs / % Proliferation without MSCs)] * 100.
Table 1: Example Matrix of Potency Assays for Immunomodulatory MSCs
| Mechanism of Action | Target CQA | Assay Type | Measured Output | Typical Range (Example) |
|---|---|---|---|---|
| Immunomodulation | Soluble mediator secretion | ELISA / MSD | IDO1 activity (Kynurenine), PGE2 concentration | IDO: 5-50 µM Kyn/10^6 cells/24h |
| Immunomodulation | Functional cell response | Co-culture & Flow Cytometry | % Inhibition of T-cell proliferation | 40-80% inhibition at 1:10 ratio |
| Anti-fibrosis | Soluble mediator secretion | ELISA | HGF secretion (pg/mL) | 500-5000 pg/mL/10^6 cells/48h |
| Angiogenesis | Paracrine signaling | Tube Formation Assay | Endothelial tube length/area | 1.5-3 fold increase vs. control |
| General Metabolic Health | Cellular activity | Luminescence | ATP content (nM) | > 80% of reference standard |
Diagram Title: GMP Potency Assay Development Workflow
The Scientist's Toolkit: Research Reagent Solutions
Table 2: Essential Reagents for MSC Potency Assay Development
| Reagent/Material | Function & Role in CQA Assessment | Key Considerations for GMP |
|---|---|---|
| Defined Culture Media & Supplements (Xeno-free) | Maintains consistent MSC phenotype and prevents unintended priming. Essential for manufacturing and pre-assay culture. | Must be GMP-grade, fully characterized, and sourced from qualified vendors. |
| Cytokine Priming Cocktail (e.g., IFN-γ, TNF-α) | Activates key immunomodulatory pathways (JAK-STAT, NF-κB) to induce effector function. Critical for potency assay relevance. | Use recombinant, high-purity, endotoxin-free cytokines. Qualify each new lot for biological activity. |
| Human PBMCs or Immortalized T-cell Lines | Provide target cells for functional co-culture assays (e.g., immunomodulation). | PBMCs: Define donor eligibility, pool if needed for variability. Cell lines: Ensure identity and mycoplasma-free status. |
| Flow Cytometry Antibodies & CFSE Kit | Enables quantification of T-cell proliferation and immune cell profiling in functional assays. | Validate antibody clones for specificity and optimal dilution. Establish staining SOPs. |
| Multiplex Immunoassay (MSD/ELISA) Kits | Quantifies secretion of critical soluble mediators (IDO, PGE2, HGF, VEGF). Links molecular CQAs to potency. | Select kits with appropriate sensitivity in biologically relevant range. Perform kit qualification. |
| Reference Standard Cell Bank | A well-characterized, stable cell stock used to calibrate assays and monitor long-term performance. | Essential for GMP. Created from a Master Cell Bank, with defined potency assigned. |
| Cell Viability Assay (e.g., ATP-based) | Measures metabolic activity as a surrogate for viability, a key safety and quality attribute. | Use a validated, reproducible method suitable for your cell type and format (e.g., 2D vs. 3D). |
Technical Support Center: Troubleshooting & FAQs
FAQ 1: Why is my MSC potency assay showing high variability between donor lots?
- Answer: High inter-donor variability is a common challenge in MSC biology. It often originates from intrinsic biological differences (age, health status) and expansion-induced senescence. To mitigate this, implement a robust donor screening protocol using early passage cells and establish a "gold standard" reference donor batch for assay normalization. Ensure all assays are performed with cells at the same passage number (e.g., P4-P6). Consider developing a multi-parameter potency assay that measures several key functions (e.g., immunomodulation, secretion) to create a more stable composite score.
FAQ 2: How do I select the most relevant biological activity to measure for my clinical indication?
- Answer: The assay must be based on a scientifically justified mechanism of action (MoA). For example:
- For GvHD or Crohn's disease: Focus on immunomodulation. Measure T-cell suppression (e.g., inhibition of PBMC proliferation) or the secretion of soluble factors like PGE2, IDO, or TGF-β.
- For myocardial infarction: Focus on paracrine secretion & angiogenesis. Measure VEGF, HGF, or FGF secretion, or use a tube formation assay with human umbilical vein endothelial cells (HUVECs).
- For osteoarthritis: Focus on anti-inflammatory & trophic activity. Measure the suppression of chondrocyte inflammation or the secretion of cartilage-protective factors. Always consult relevant regulatory guidance (FDA, EMA) and literature to align your assay with the proposed clinical use.
FAQ 3: My cell-based assay is failing GMP reproducibility criteria. What are the critical parameters to control?
- Answer: Cell-based assays are sensitive to multiple variables. Control these key parameters:
| Parameter | Target | Rationale |
|---|---|---|
| Cell Passage Number | Strict range (e.g., P4-P6) | Prevents senescence-related drift in function. |
| Seeding Density | ± 10% of validated density | Critical for cell-cell contact & secretome. |
| Serum Lot | Single, qualified lot for all GMP testing | Serum components greatly affect MSC behavior. |
| Assay Reagent Warm-up | Consistent time at 37°C (e.g., 30 min) | Ensures consistent metabolic start state. |
| Operator Training | ≥ 3 independent runs for qualification | Minimizes inter-operator variability. |
FAQ 4: What are the critical steps in qualifying a GMP-compliant potency assay?
- Answer: Follow a tiered approach:
- Analytical Validation: Establish specificity, accuracy, precision (repeatability & intermediate precision), linearity, range, and robustness. A design of experiments (DoE) approach is recommended for robustness testing.
- Stability-Indicating: Demonstrate the assay can detect loss of function in stressed cells (e.g., heat-treated, high passage, cryo-recovery).
- Correlation with In Vivo Activity: Where possible, correlate the in vitro assay result with an in vivo model of efficacy.
- Documentation: Create a detailed Analytical Test Method (ATM) and Validation Report per ICH Q2(R2) and USP <1033> principles.
Experimental Protocols
Protocol 1: Standardized T-Cell Suppression Assay for Immunomodulatory Potency
Purpose: To quantify the ability of MSCs to suppress the proliferation of activated peripheral blood mononuclear cells (PBMCs). Materials: See "Scientist's Toolkit" below. Method:
- MSC Preparation: Plate irradiated (50 Gy) MSCs from the test batch in a 96-well flat-bottom plate at 5x10³ cells/well in complete assay medium. Incubate overnight.
- PBMC Activation: Isolate PBMCs from a qualified donor. Label with CFSE (2.5 µM). Stimulate with anti-CD3/CD28 activator beads at a 1:1 bead:cell ratio.
- Co-culture: Add 1x10⁵ activated, CFSE-labeled PBMCs to the MSC monolayer. Include controls (PBMCs alone, PBMCs + activator).
- Incubation: Culture for 5 days at 37°C, 5% CO₂.
- Analysis: Harvest non-adherent cells. Analyze CFSE dilution by flow cytometry. Calculate % suppression:
[1 - (Proliferation in Co-culture / Proliferation of PBMCs alone)] * 100.
Protocol 2: Multi-Analyte Secretion Profiling via Luminex
Purpose: To establish a quantitative, multi-parameter secretory profile for MSC potency lot release. Materials: Luminex xMAP kit for human cytokines (e.g., VEGF, HGF, IL-6, PGE2, IDO), Luminex analyzer or compatible reader. Method:
- Conditioned Media Collection: Plate MSCs at a validated density (e.g., 2x10⁴ cells/cm²). After 24h, replace growth medium with serum-free collection medium. Culture for 48h. Collect supernatant, centrifuge to remove debris, and store at -80°C.
- Assay Setup: Thaw samples on ice. Follow manufacturer's protocol for the multiplex kit. Briefly, add standards, controls, and samples to antibody-coated bead wells. Incubate, wash, then add biotinylated detection antibody. Follow with streptavidin-PE.
- Data Acquisition: Read plate on the analyzer. Generate a standard curve for each analyte.
- Data Normalization: Normalize analyte concentration to the cell number or total protein content of the producing well. Report as pg/10⁶ cells/48h.
Diagrams
Title: MSC Potency Assay Lifecycle Integration
Title: Key MSC Immunomodulation via IDO1 Pathway
The Scientist's Toolkit: Research Reagent Solutions
| Item | Function & Justification |
|---|---|
| Human MSC Serum/XF Media | Defined, serum-free medium for consistent expansion and secretome analysis. Eliminates lot-to-lot variability of FBS. |
| Recombinant Human IFN-γ | Critical for priming MSCs to enhance immunomodulatory functions (IDO, PGE2 upregulation) in potency assays. |
| Anti-human CD3/CD28 Activator Beads | Provides consistent, strong polyclonal T-cell activation for suppression assays, replacing variable PBMC donors. |
| CFSE Cell Proliferation Dye | Fluorescent dye for tracking and quantifying PBMC proliferation divisions via flow cytometry in co-culture assays. |
| Luminex Multiplex Assay Kits | Enables simultaneous, quantitative measurement of multiple secreted potency factors (VEGF, HGF, etc.) from small sample volumes. |
| Cell Viability Reagent (e.g., Calcein AM) | Fluorescent dye for live-cell imaging to confirm MSC monolayer health pre- and post-co-culture. |
| Validated Donor PBMCs, Cryopreserved | Standardized responder cells for inter-assay consistency in immunomodulation potency testing. |
From Concept to Lab: Building Your GMP-Ready MSC Potency Assay Toolkit
Troubleshooting Guides & FAQs
Q1: Our co-culture assay shows high variability in T-cell suppression readings between replicates. What are the primary sources of this variability and how can we minimize them? A: Key sources are donor-to-donor variability in PBMC/T-cell responders, inconsistent MSC seeding density, and suboptimal activation of immune cells. For GMP assay development, standardize responder cell sourcing (e.g., use a characterized cryopreserved PBMC pool), implement precise, automated cell seeding, and titrate your T-cell activator (e.g., anti-CD3/CD28 beads) to achieve a consistent and robust baseline proliferation.
Q2: When using PBMCs versus isolated CD3+ T-cells, we observe different suppression magnitudes. Which is more appropriate for a potency assay? A: For a GMP-compliant potency assay, purified CD3+ T-cells are often preferred. While PBMCs provide a more physiologically relevant system, the inclusion of monocytes and NK cells introduces confounding variables, as monocytes can differentiate into suppressive macrophages and NK cells can kill MSCs. Using purified T-cells improves assay specificity and reproducibility, which are critical for lot-release testing. The chosen system should be justified based on the product's mechanism of action.
Q3: Our MSCs fail to suppress T-cell proliferation, even at high effector-to-target ratios. What are the critical control experiments to run? A: First, verify the functionality of all components:
- Positive Suppression Control: Use a pharmacologic inhibitor (e.g., dexamethasone) to confirm the assay can detect suppression.
- T-cell Activation Control: Ensure T-cells/PBMCs proliferate robustly in the absence of MSCs (activation-only well). Low proliferation leaves no window for suppression.
- MSC Viability & Confluence: Confirm MSCs are healthy, adherent, and at the correct confluence (~70-80%) at assay start.
- MSC Licensing: Test if pre-treatment with IFN-γ (e.g., 25 ng/mL for 24-48h) enhances suppression, as this induces IDO1 expression, a key mediator.
Q4: How do we standardize the analysis of suppression data, particularly when baseline proliferation varies between assays?
A: Normalize data to the activated control. Calculate % Suppression as: [1 - (Proliferation in Co-culture / Proliferation of Activated T-cells alone)] * 100. For GMP assays, establish a validated range for the activated control proliferation (e.g., stimulation index > 10) and report results relative to a reference standard (e.g., a master MSC bank) included on every plate to control for inter-assay variability.
Q5: What is the impact of cell-cell contact versus soluble factors in our co-culture setup, and how can we test it? A: MSC-mediated immunomodulation involves both contact-dependent (e.g., PD-L1) and soluble factors (e.g., PGE2, IDO1). To dissect mechanisms, include a transwell condition where MSCs are cultured in an insert, physically separated from T-cells but sharing media. Similar suppression in transwell indicates a predominantly soluble mechanism. This is critical for understanding your product's Critical Quality Attributes (CQAs).
Table 1: Impact of Effector-to-Responder (E:R) Ratio on Suppression
| E:R Ratio (MSC:T-cell) | Typical % Suppression Range* | Recommended Use Case |
|---|---|---|
| 1:2 | 70% - 90% | High-potency screening |
| 1:5 | 50% - 80% | Standard potency assay |
| 1:10 | 20% - 60% | Sensitivity testing |
| 1:20 | 10% - 40% | Detecting low-activity batches |
*Data compiled from published MSC co-culture studies. Baseline is activated T-cell proliferation.
Table 2: Key Soluble Mediators & Their Modulation
| Mediator | Typical Detection Method | Impact of IFN-γ Licensing (Fold Increase) |
|---|---|---|
| IDO1 Activity (Kynurenine) | HPLC / Colorimetric Assay | 5 - 20x |
| PGE2 | ELISA | 3 - 10x |
| TGF-β1 | ELISA / Luminex | 1.5 - 3x |
| HLA-G | Flow Cytometry | 2 - 5x |
Experimental Protocol: GMP-Ready T-cell Suppression Assay
Title: Quantitative Potency Assay for MSC Immunomodulatory Function.
Objective: To measure the in vitro suppression of activated T-cell proliferation by MSCs in a reproducible, plate-based format suitable for lot-release testing.
Materials:
- Test and Reference Standard MSCs (Passage 3-5)
- Cryopreserved Human CD3+ T-cells (from ≥3 donors or pooled)
- X-VIVO 15 or RPMI-1640 + 10% FBS
- Anti-CD3/CD28 Activator Beads
- IFN-γ (for licensed condition)
- 96-well flat-bottom tissue culture plate
- [3H]-thymidine or BrdU/EdU kit
Procedure:
- MSC Plating (Day -1): Harvest and count MSCs. Seed in triplicate in a 96-well plate at 3,000, 6,000, and 12,000 cells/well in 100µL to establish E:R ratios of 1:20, 1:10, and 1:5. Include MSC-only background control wells. Incubate overnight (37°C, 5% CO2).
- Optional Licensing (Day 0): Add IFN-γ (25 ng/mL final concentration) to designated wells. Incubate 24h.
- T-cell Activation & Co-culture (Day 1): Thaw and count CD3+ T-cells. Prepare activation mix: T-cells (e.g., 60,000/well for 1:10 ratio) + anti-CD3/CD28 beads at a 1:1 bead-to-cell ratio. Aspirate media from MSC plate. Add 100µL of T-cell/bead suspension to MSC wells. Set up controls: T-cells + beads alone (Max Proliferation), T-cells alone (Background), Beads alone.
- Proliferation Pulse (Day 4): Add 10µL of [3H]-thymidine (1 µCi/well) or BrdU/EdU per manufacturer's instructions. Incubate for 6-18h.
- Harvest & Measurement (Day 5): Harvest cells onto a filtermat using a cell harvester. Measure incorporated radioactivity via a beta-counter or detect BrdU/EdU by plate reader.
- Analysis: Calculate % suppression for each E:R ratio. Plot a dose-response curve. Compare test article suppression to the reference standard at a specified ratio (e.g., 1:10).
Signaling Pathways & Workflows
Diagram 1: Key MSC Immunomodulatory Pathways in Co-culture
Diagram 2: Co-culture Assay Workflow for Potency
The Scientist's Toolkit: Research Reagent Solutions
Table 3: Essential Materials for Co-culture Assays
| Item | Function & GMP-Relevance | Example/Note |
|---|---|---|
| Defined MSC Media | Supports MSC growth without animal sera; critical for xeno-free, consistent production. | X-VIVO 15, STEMMACULT-XF. |
| Characterized PBMC/CD3+ T-cells | Standardized responder cells reduce donor-derived variability in potency readouts. | Cryopreserved, pooled donor cells from qualified vendors. |
| Anti-CD3/CD28 Activator | Provides consistent, strong TCR stimulation for reproducible baseline T-cell proliferation. | MACSiBead particles or similar. |
| Recombinant Human IFN-γ | Used to license/pre-condition MSCs, inducing key mediators like IDO1. | GMP-grade available for production. |
| Proliferation Assay Kit | Quantifies T-cell division. Non-radioactive methods (BrdU/EdU) are preferred for GMP. | Colorimetric or fluorometric ELISA kits. |
| Multiplex Cytokine Array | Measures secreted factors (IL-2, IFN-γ, IL-10, etc.) for deeper mechanism profiling. | Luminex or MSD platforms. |
| Transwell Inserts | Physically separates MSCs from responders to study soluble factor mechanisms. | 0.4µm pore size, compatible with assay plate. |
Troubleshooting Guides & FAQs
ELISA for Secretome Analysis
Q: My ELISA standard curve has a poor fit (R² < 0.95), compromising quantification of MSC secretome factors like VEGF or HGF. What should I do? A: This is often due to improper standard reconstitution, pipetting errors, or plate-washing issues. Ensure the standard is reconstituted in the same matrix as your samples (e.g., serum-free basal media). Perform serial dilutions using fresh tips and calibrated pipettes. Check washer manifolds for clogging. Always include a fresh standard curve on every plate.
Q: I'm getting high background across all wells, including blanks. A: Likely causes are insufficient washing, non-specific binding, or contaminated reagents. Increase wash cycles to 5-6 times with thorough soaking. Ensure your blocking buffer (e.g., 1% BSA or 5% non-fat dry milk in PBS) is fresh and applied for at least 1 hour. Prepare fresh wash buffer.
MSD & Luminex Multiplex Assays
Q: My multiplex assay shows signal saturation in some channels but low signal in others for my MSC-conditioned media. A: The dynamic range of analytes (e.g., high IL-6, low IL-10) may exceed the assay's range. Pre-dilute your sample for high-abundance analytes and run a separate, undiluted sample for low-abundance ones. Always perform a spike-and-recovery experiment in your specific sample matrix to validate dilution factors.
Q: Recovery of spiked standards in my MSC secretome samples is low (<70% or >130%). A: Matrix interference is common. For MSD/Luminex, use the provided diluent or validate an alternative (e.g., assay buffer with 1-2% serum). You may need to dilute the sample further to minimize interference, provided the analyte remains above the lower limit of quantification (LLOQ).
Flow Cytometry for Surface Markers
Q: The fluorescence intensity for MSC markers (CD90, CD105) is weak, despite using validated antibodies. A: Check cell viability and antibody titration. Apoptotic/dead MSCs show reduced marker expression. Re-titrate antibodies on a fresh MSC batch. Ensure you are using a validated GMP-compatible staining buffer and include a live/dead viability dye (e.g., propidium iodide) to gate on viable cells only.
Q: High non-specific staining is observed in the isotype control, muddying the positivity for low-abundance markers. A: Fc receptor blocking is crucial for MSCs. Incubate cells with an Fc block (e.g., human IgG) for 10-15 minutes prior to antibody staining. Ensure your isotype control is matched to the primary antibody's host, isotope, and fluorochrome. Increase wash stringency (use PBS with 0.5% BSA and 2mM EDTA).
Q: How do I set up a potency assay for MSCs using these techniques? A: A GMP-compliant potency assay links specific MSC functions (e.g., immunomodulation) to quantifiable biomarkers. For example, correlate T-cell suppression with MSC PGE2 secretion measured by ELISA. The assay must be validated for precision (CV < 20%), accuracy (70-130% recovery), linearity, and robustness per ICH Q2(R1) guidelines.
Table 1: Performance Comparison of Secretome Quantification Platforms
| Platform | Sensitivity (Typical) | Dynamic Range | Multiplexing Capacity | Sample Volume (µL) | Approximate Cost per Sample |
|---|---|---|---|---|---|
| ELISA | 1-10 pg/mL | 2-3 logs | Singleplex | 50-100 | $ |
| MSD | 0.1-1 pg/mL | 3-4 logs | Up to 10-plex | 25-50 | $ |
| Luminex | 0.5-5 pg/mL | 3-4 logs | Up to 50-plex | 25-50 | $ |
Table 2: Critical Quality Attributes for MSC Flow Cytometry (ISCT Minimal Criteria)
| Surface Marker | Expected Positivity (GMP-grade MSCs) | Common Fluorochromes | Purpose in Potency Assay Context |
|---|---|---|---|
| CD90 | >95% | FITC, PE, APC | Identity, Purity |
| CD105 | >95% | PE, BV421 | Identity, Purity |
| CD73 | >95% | APC, PE-Cy7 | Identity, Purity |
| CD45 | <2% | FITC, PerCP-Cy5.5 | Purity (exclusion) |
| CD34 | <2% | PE, APC | Purity (exclusion) |
| HLA-DR | <5% (for allogeneic) | FITC, BV510 | Safety (immunogenicity risk) |
Experimental Protocols
Protocol 1: GMP-Compliant Secretome Collection for MSC Potency Assay
- Cell Culture: Expand MSCs to passage 3-5 in validated, serum-free, xeno-free media under standard conditions (37°C, 5% CO2).
- Conditioning: At ~80% confluence, wash cells 3x with sterile PBS. Add fresh basal, serum-free media (no growth factors).
- Incubation: Culture for 48 hours. This time frame is standardized for the potency assay.
- Collection: Harvest conditioned media into sterile tubes. Centrifuge at 300 x g for 10 min to remove cells, then at 2000 x g for 20 min to remove debris.
- Aliquoting & Storage: Aliquot supernatant and store at ≤ -70°C. Avoid freeze-thaw cycles. Include a sample of basal media as a negative control.
Protocol 2: Validated Flow Cytometry Assay for MSC Identity/Purity
- Cell Harvest: Detach MSCs using a validated enzyme-free method (e.g., EDTA). Wash in PBS.
- Count & Viability: Determine viability (>90% required) using Trypan Blue.
- Aliquot: Dispense 1 x 10^5 cells per tube (for each marker/isotype).
- Fc Block: Incubate cells with human IgG (1 µg/10^6 cells) in staining buffer for 15 min on ice.
- Stain: Add pre-titrated antibody cocktails directly (no wash). Incubate for 30 min in the dark on ice.
- Wash: Add 2 mL staining buffer, centrifuge at 300 x g for 5 min. Aspirate supernatant. Repeat once.
- Resuspend & Acquire: Resuspend in 200-300 µL of PBS with 1% formaldehyde (if fixed) or staining buffer. Acquire on a calibrated flow cytometer within 4 hours. Collect a minimum of 10,000 events in the live cell gate.
The Scientist's Toolkit: Research Reagent Solutions
| Item | Function in MSC Biomarker Analysis |
|---|---|
| Serum-free, xeno-free MSC media | Provides defined culture conditions for secretome collection, minimizing background in immunoassays. |
| Human AB Serum (for some cultures) | A GMP-compliant alternative to FBS for expansion without introducing animal antigens. |
| Recombinant protein standards (VEGF, HGF, IDO, PGE2 ELISA) | Essential for generating accurate standard curves to quantify specific secretome factors. |
| Multiplex panel kits (e.g., Human Cytokine 30-Plex) | Validated, ready-to-use panels for simultaneous quantification of multiple secretome factors from limited samples. |
| Pre-conjugated antibody clones (CD90/Thy1, CD105/Endoglin) | GMP-relevant, directly labeled antibodies for reproducible flow cytometry identity testing. |
| 7-AAD or Propidium Iodide viability dye | Allows exclusion of dead cells during flow analysis, critical for accurate marker quantification. |
| PE- and APC-conjugated isotype controls | Matched controls essential for distinguishing specific signal from non-specific binding in flow cytometry. |
| ELISA/Luminex sample diluent with matrix | Optimized buffer to reduce matrix effects and improve recovery of analytes from conditioned media. |
| Flow cytometry staining buffer (PBS/BSA/EDTA) | Preserves cell integrity, reduces clumping, and minimizes non-specific antibody binding during staining. |
| Micro-bead standards for flow cytometer | Required for daily calibration (CST) and performance tracking of the instrument. |
Diagrams
Diagram 1: MSC Potency Assay Workflow Linking Biomarkers to Function
Diagram 2: Flow Cytometry Gating Strategy for MSC Identity
Diagram 3: Secretome Analysis Pathway for Immunomodulation
Welcome to the Technical Support Center. This resource provides troubleshooting and methodological guidance for implementing advanced analytical techniques within the context of developing robust, GMP-compliant potency assays for Mesenchymal Stromal Cell (MSC) therapies.
Frequently Asked Questions (FAQs) & Troubleshooting
Q1: Our single-cell RNA-seq data from MSC batches shows high donor-to-donor transcriptional variability. How can we identify a consistent potency signature suitable for a GMP assay? A: Focus on pathway-level analysis over individual genes. Use gene set enrichment analysis (GSEA) or single-cell pathway scoring tools (e.g., AUCell, Seurat's AddModuleScore) to convert transcriptional noise into reproducible pathway activity metrics. For potency, correlate pathway scores (e.g., "Immunomodulation," "Angiogenesis") with functional assay outcomes across multiple donors. A consistent in vitro functional readout coupled with a pathway score is more GMP-amenable than a fixed gene list.
Q2: When performing proteomic analysis (e.g., LC-MS/MS) on MSC secretomes, we encounter high-abundance serum protein contamination masking low-abundance bioactive factors. How do we resolve this? A: Implement a serum-free conditioning phase. Culture MSCs in a defined, serum-free/xeno-free medium for 24-48 hours prior to secretome collection. Use affinity-based depletion columns (e.g., for bovine albumin) as a pre-fractionation step. Additionally, leverage tandem mass tag (TMT) or label-free quantification with dedicated bioinformatics filters to subtract proteins originating from the baseline culture medium.
Q3: Our AI model for predicting MSC immunomodulatory potency from transcriptomic data performs well on training data but fails on new donor samples. What are likely causes and fixes? A: This indicates overfitting and poor model generalization.
- Cause 1: The training dataset is too small or lacks donor diversity.
- Fix: Use data augmentation techniques (e.g., SMOTE for synthetic samples) and incorporate publicly available datasets from GEO or ArrayExpress. Prioritize models with simpler architectures (e.g., regularized linear models, Random Forest) before deep learning.
- Cause 2: Batch effects between your training and validation cell preparations.
- Fix: Apply robust batch correction algorithms (ComBat, Harmony) to your transcriptomic data before model training. Ensure your training pipeline includes rigorous cross-validation splits by donor, not just by sample.
Q4: How can we establish a direct quantitative link between proteomic secretome data and a functional potency assay? A: Employ a targeted proteomics approach (e.g., Multiple Reaction Monitoring - MRM or Parallel Reaction Monitoring - PRM) after discovery-phase LC-MS/MS.
- From your discovery data, select 3-5 key candidate potency proteins (e.g., IDO1, PGE2 synthases, Galectins).
- Develop an MRM/PRM assay using stable isotope-labeled (SIL) peptide standards for absolute quantification of these proteins in the secretome.
- Statistically correlate the absolute protein concentrations with the dose-response metrics from your functional assay (e.g., T-cell suppression percentage).
Detailed Experimental Protocols
Protocol 1: Integrating scRNA-seq with Functional Potency Data for Biomarker Discovery
- Objective: Identify transcriptomic modules predictive of in vitro immunomodulatory potency.
- Steps:
- Cell Preparation: Generate single-cell suspensions from at least 5 different donor-derived MSC batches cultured under standardized, serum-free conditions.
- Parallel Processing: Split each batch: a portion for scRNA-seq (10X Genomics Chromium) and a portion for a co-culture functional assay (e.g., inhibition of PHA-stimulated PBMC proliferation).
- Bioinformatics:
- Process scRNA-seq data (Cell Ranger -> Seurat/Scanpy). Regress out cell cycle effects.
- Perform clustering and annotate cell states.
- Calculate pathway activity scores for each cell using pre-defined "immunomodulatory" gene sets from MSigDB.
- Aggregate the mean pathway score per donor batch.
- Integration: Create a correlation table between donor-aggregated pathway scores and the corresponding donor's functional potency (IC50 or max suppression %). The highest-correlating pathway(s) become candidate potency markers.
Protocol 2: Targeted Secretome Analysis via LC-MS/MS with MRM Quantification
- Objective: Absolutely quantify key bioactive factors in MSC-conditioned medium.
- Steps:
- Sample Preparation: Concentrate serum-free conditioned medium using 3kDa centrifugal filters. Perform in-solution tryptic digestion.
- Discovery Phase (ID): Analyze a subset of samples by data-dependent acquisition (DDA) LC-MS/MS to identify proteins present.
- Target Selection: Curate a list of target proteins and their proteotypic peptides (2-3 per protein). Synthesize corresponding SIL peptides.
- MRM Assay Development: Use triple-quadrupole MS. Optimize collision energies for each peptide transition. Establish a calibration curve by spiking known amounts of SIL peptides into a constant background of digested control medium.
- Quantitative Run: Spike a fixed amount of SIL peptide mix into all test samples as an internal standard. Run samples using scheduled MRM. Quantify based on the heavy/light peptide peak area ratio.
Data Presentation
Table 1: Correlation of Aggregated scRNA-seq Pathway Scores with In Vitro T-cell Suppression Potency
| MSC Donor Batch | Mean "Response to IFN-γ" Score (AU) | Mean "Chemokine Activity" Score (AU) | T-cell Suppression (%) at 1:10 MSC:PBMC ratio |
|---|---|---|---|
| Donor A | 1.85 | 0.72 | 65% |
| Donor B | 0.91 | 1.45 | 38% |
| Donor C | 2.30 | 0.88 | 78% |
| Donor D | 1.20 | 1.10 | 52% |
| Pearson's r (vs. Suppression) | 0.94 | 0.15 | -- |
Table 2: MRM Quantification of Candidate Potency Proteins in Conditioned Medium
| Target Protein | Peptide Sequence | LOD (fmol/µg) | LOQ (fmol/µg) | Concentration in High-Potency Batch (fmol/µg total protein) | Concentration in Low-Potency Batch (fmol/µg total protein) |
|---|---|---|---|---|---|
| IDO1 | IIGVEDVEK | 0.1 | 0.5 | 12.5 | 1.2 |
| PTGES2 | TLLSALIK | 0.05 | 0.2 | 8.7 | 7.9 |
| LGALS1 | VFFSEYK | 0.02 | 0.1 | 45.6 | 15.3 |
Mandatory Visualizations
Title: Integrated Multi-Omics Potency Assay Development Workflow
Title: IDO1-Mediated Immunomodulation as a Potency Marker Pathway
The Scientist's Toolkit: Research Reagent Solutions
| Item/Category | Function in MSC Potency Assay Development |
|---|---|
| Defined, Xeno-Free MSC Media | Provides a consistent, contaminant-free base for cell expansion and secretome collection, crucial for reproducible proteomics and functional assays. |
| Single-Cell 3' GEM Kits (10X Genomics) | Enables high-throughput scRNA-seq library prep for capturing donor and subpopulation heterogeneity. |
| Tandem Mass Tag (TMT) Pro Sets | Allows multiplexed quantitative comparison of secretomes from up to 16 different MSC batches/donors in a single LC-MS/MS run. |
| Stable Isotope-Labeled (SIL) Peptide Standards | Provides internal standards for absolute quantification of target potency proteins (e.g., IDO1, GAL-1) via MRM/PRM mass spectrometry. |
| Recombinant Human IFN-γ | Used as a critical quality attribute (CQA) stimulant in potency assay development to trigger immunomodulatory pathways. |
| Anti-Human IDO1 Antibody (for ELISA/WB) | Enables orthogonal validation of proteomics data and development of simpler, QC-friendly potency assays. |
| Peripheral Blood Mononuclear Cells (PBMCs) | Primary effector cells for performing gold-standard in vitro immunomodulation potency assays (e.g., suppression of proliferation). |
| CellTrace Proliferation Dyes | Allows flow cytometry-based measurement of T-cell proliferation inhibition by MSCs in co-culture assays. |
Troubleshooting Guides & FAQs
Q1: Why do my MSC potency assay results show high variability, even when using the same cell batch? A: MSC functional heterogeneity is a key factor. A single assay often captures only one aspect of their complex mode of action (MoA). Variability can arise from:
- Assay Sensitivity: The chosen assay may not be sensitive to the critical bioactive factor(s) secreted by that specific MSC batch.
- Dynamic Secretome: MSC secretion profiles change with passage, confluence, and donor.
- Inadequate Matrix: Relying on a single endpoint (e.g., IL-10 secretion) fails to represent immunomodulation, which involves multiple pathways (IDO, PGE2, TGF-β).
- Troubleshooting Step: Implement a small panel (3-4 assays) targeting different MoA aspects. For example, pair an immunosuppression co-culture assay with quantitative PCR for key mediators (IDO1, PTGES2) and a chemotaxis assay. This matrix provides a correlated data set, reducing noise from any single readout.
Q2: How do I choose which assays to include in a potency panel for a GMP-compliant filing? A: The panel must be quality-by-design (QbD) driven and linked directly to the proposed clinical mechanism.
- Identify Critical Quality Attributes (CQAs): Based on non-clinical data, define the MSC functions essential for efficacy (e.g., T-cell suppression, angiogenesis promotion).
- Map CQAs to Measurable Potency Assays: Each CQA requires at least one relevant, validated, and stability-indicating assay.
- Justify Redundancy: Include orthogonal assays (different principles) for the same CQA to ensure robustness. For immunosuppression, this could be a functional T-cell proliferation assay and a quantitative IDO enzyme activity assay.
- Link to Release Specs: Establish a multi-parametric release criterion (e.g., Pass/Fail thresholds for each assay in the panel).
Q3: Our single ELISA-based potency assay failed during method qualification due to poor precision. What are alternatives? A: ELISA for a single soluble factor is often insufficient. Consider these alternatives or supplements:
| Assay Type | Target/Principle | Throughput | Key Advantage for MSCs | Typical CV Requirement |
|---|---|---|---|---|
| Co-culture Functional Assay | T-cell or PBMC proliferation inhibition | Medium | Measures integrated biological effect | ≤ 25% |
| Multiplex Luminex | Quantification of 10+ cytokines (IL-6, VEGF, HGF, etc.) | High | Captures secretome profile; more robust than single ELISA | ≤ 20% per analyte |
| qRT-PCR | Gene expression of IDO1, COX2, TSG-6 | High | Measures upstream regulatory response; highly precise | ≤ 15% |
| Flow Cytometry-Based | Surface marker induction (e.g., CD206 on macrophages) | Low-Medium | Measures complex cellular interaction outcome | ≤ 20% |
Q4: What are the critical protocol steps for a robust MSC-mediated T-cell suppression assay? A: Protocol: MSC & PBMC Co-culture for Immunomodulation Potency.
- MSC Preparation: Plate γ-irradiated (or mitomycin-C treated) MSCs from the test batch and a reference standard in a 96-well flat-bottom plate 24h prior. Use a minimum of 3 cell densities (e.g., 1:10, 1:50, 1:250 MSC:PBMC ratio).
- PBMC Activation: Isolate PBMCs from a qualified human donor. Label with CFSE or a viable cell dye. Stimulate with CD3/CD28 activation beads or PHA.
- Co-culture: Add activated PBMCs to the MSC monolayer. Include controls: PBMCs alone (max proliferation), PBMCs + immunosuppressant (e.g., dexamethasone, for inhibition control).
- Incubation: Culture for 3-5 days.
- Analysis: Measure T-cell proliferation via flow cytometry (CFSE dilution) or by ATP quantification (luminescence). Calculate % suppression:
[1 - (Proliferation in Co-culture / Proliferation of PBMCs alone)] * 100. - Key: Use the same PBMC donor for a complete assay run to minimize variability. Establish a dose-response curve using MSC density.
Q5: How can we demonstrate our potency panel is stability-indicating for a shelf-life claim? A: You must perform forced degradation studies on multiple MSC batches.
- Stress Conditions: Expose MSCs to extended passage (e.g., to senescence), prolonged room temperature hold, or freeze-thaw cycles.
- Panel Testing: Assess the degraded samples with the full potency panel.
- Data Correlation: Show a significant, trended decline in multiple assay readouts (e.g., reduced T-cell suppression, decreased angiogenic factor secretion, lower key gene expression) correlating with loss of cell viability or metabolic activity. A single assay may not show a trend; a panel provides a conclusive loss-of-potency profile.
Visualizing the MSC Potency Assay Matrix Strategy
(MSC Potency Panel Derivation from CQAs)
(Key MSC Immunomodulation Pathway via IDO1)
The Scientist's Toolkit: Key Reagent Solutions
| Reagent / Material | Function in MSC Potency Testing | Critical Note for GMP |
|---|---|---|
| Reference Standard MSC Cell Bank | Provides a biological baseline for inter-assay comparison and trend analysis. Essential for panel qualification. | Must be fully characterized, from a Master Cell Bank, and aliquoted for long-term use. |
| Qualified Single-Donor PBMCs | Used as responder cells in immunomodulation assays (e.g., T-cell suppression). | Use cryopreserved batches from screened donors. Quality control for consistent responsiveness. |
| CD3/CD28 Activator Beads | Provides consistent, strong polyclonal T-cell activation in co-culture assays. | Prefer GMP-grade or well-characterized reagents for robustness. |
| Multiplex Cytokine Assay Kits (e.g., Luminex) | Enables simultaneous quantification of a panel of MSC-secreted factors (VEGF, IL-6, HGF, etc.). | Validate for precision, accuracy, and linearity in your cell culture matrix. |
| qPCR Assays for IDO1, PTGES2, TSG-6 | Quantifies expression of key potency genes, often more precise than protein detection. | Use pre-validated, sequence-specific primer/probe sets. Control for RNA extraction efficiency. |
| Matrigel or Extracellular Matrix | Provides the 3D substrate for endothelial tube formation assays (angiogenesis). | Lot-to-lot variability is high; qualify and reserve a single lot for critical studies. |
| Cell Viability Assay (ATP-based) | Used as a correlative, non-potency assay to confirm loss of function in stability studies. | Must be orthogonal and not interfere with potency readouts. |
Technical Support Center
FAQs & Troubleshooting Guides
Q1: Our IDO (Indoleamine 2,3-dioxygenase) potency assay for MSC products targeting GvHD shows high inter-assay variability. What are the critical control points? A: High variability often stems from IFN-γ stimulation consistency and tryptophan/kynurenine measurement. Implement these controls: 1) Pre-qualify every lot of IFN-γ using a reference MSC line with a known kynurenine production range (e.g., 50-80 µM after 48h). 2) Include a 3-point standard curve of L-kynurenine (0, 25, 50 µM) in every HPLC/MS plate. 3) Normalize data to both cell count (via DNA quantitation) and a housekeeping protein (e.g., total cellular protein). Ensure serum-free conditions during the assay to avoid interference.
Q2: For Crohn's Disease fistula healing assays, our in vitro scratch/wound closure assay does not correlate with in vivo efficacy. How can we improve physiological relevance? A: The standard 2D scratch assay lacks the inflammatory milieu. Implement a 3D co-culture assay using: 1) Fibroblast-Colonocyte Co-culture: Seed human colon fibroblasts (CCD-18Co) in collagen gel, overlay with epithelial cells (Caco-2/T84). Create a mechanical wound. 2) Conditioning: Add patient-derived serum or a cytokine cocktail (TNF-α 10 ng/mL, IL-1β 5 ng/mL, IFN-γ 25 ng/mL) 24h prior to MSC addition. 3) Readout: Measure closure rate over 72h via live imaging and quantify secretory mediators (PGE2, TSG-6) in supernatant. This better predicts fistula tract closure.
Q3: When testing MSC chondrogenic potency for Osteoarthritis (OA), pellet culture assays are slow and qualitative. Are there quantitative alternatives compliant with GMP lot release? A: Yes, move to a 2D high-content imaging assay. Seed MSCs in 96-well plates and stimulate with a defined chondrogenic medium (TGF-β3, BMP-6, ascorbate). At day 7, fix and stain for early chondrogenic markers (Sox9, Collagen II). Use automated imaging to quantify: 1) Nuclear Sox9 Intensity/Cell, and 2) Percentage of Cells with Organized Collagen II Fibrils. Correlate these values with the GAG/DNA content of traditional pellet cultures from the same donor. This offers a faster, quantitative release assay.
Q4: Our flow cytometry-based immunomodulation assay (for GvHD) using PBMC proliferation dyes shows high background. How to troubleshoot? A: Background arises from dye transfer or non-specific lymphocyte activation.
- Step 1: Check dye concentration. For CFSE, use a final concentration of 0.5-1 µM, not 5-10 µM commonly used for lymphocytes alone.
- Step 2: Include a "MSC-only" control to check for dye uptake by MSCs, which can be transferred to lymphocytes. Quench with trypan blue post-staining if needed.
- Step 3: Ensure PBMC activator (e.g., anti-CD3/CD28 beads) is titrated. Use a sub-optimal ratio (e.g., 1 bead:10 cells) to allow observable MSC-mediated suppression.
- Protocol: Isolate PBMCs from ≥3 donors. Label with 1 µM CFSE for 10 min at 37°C, quench with 5x volume of cold serum. Co-culture with MSCs (MSC:PBMC ratio 1:10) + anti-CD3/CD28 beads (1:10 bead:cell ratio) for 5 days. Run flow cytometry gating on lymphocyte forward/side scatter. Calculate division index of CD3+ cells.
Table 1: Key Potency Assay Parameters for MSC Indications
| Indication | Target Mechanism | Recommended Assay Format | Critical Reagents & Controls | Typical Acceptance Range (Donor-Matched Reference MSC) | Assay Duration |
|---|---|---|---|---|---|
| Graft vs. Host Disease (GvHD) | IDO-mediated T-cell suppression | IFN-γ stimulated IDO activity | Human IFN-γ (≥1000 U/mL), L-Tryptophan, Kynurenine Standard, HPLC/MS | Kynurenine Production: 40-120 µM/1e6 cells/48h | 48-72 hours |
| Crohn's Fistula | PGE2/TSG-6 mediated repair & immunomodulation | 3D Inflammatory Wound Closure | TNF-α, IL-1β, IFN-γ cocktail, Collagen Type I Matrix, PGE2 ELISA | Wound Closure @72h: ≥40% vs. untreated control; PGE2 release: 2-5 ng/mL | 72-96 hours |
| Osteoarthritis (OA) | Chondrogenic differentiation & matrix production | 2D High-Content Chondrogenic Imaging | TGF-β3 (10 ng/mL), BMP-6 (100 ng/mL), Anti-Sox9/Collagen II antibodies | ≥65% Sox9+ nuclei; ≥30% Col II+ cells | 7-10 days |
Experimental Protocols
Protocol 1: GMP-Compliant IDO Potency Assay for GvHD
- Cell Seeding: Plate passage 3-5 MSCs (from the GMP master cell bank) in a 96-well plate at 20,000 cells/well in complete growth medium. Incubate overnight (37°C, 5% CO2).
- Stimulation: Aspirate medium. Add serum-free medium (e.g., X-VIVO 15) containing 500 U/mL of qualified, GMP-grade recombinant human IFN-γ. Include unstimulated control wells (serum-free medium only).
- Incubation: Incubate for 48±2 hours.
- Supernatant Collection: Transfer 100 µL of supernatant to a clean microtube. Centrifuge at 500xg for 5 min to remove debris.
- Kynurenine Quantification: Using a validated HPLC-MS/MS method: Inject 10 µL of cleared supernatant. Quantify kynurenine against a 6-point standard curve (0-100 µM). Normalize results to the total cellular protein content per well (measured via Lowry or BCA assay).
- Acceptance Criteria: The IFN-γ-stimulated well must show a ≥5-fold increase in kynurenine over the unstimulated control. The reference MSC standard must fall within its predefined historical range.
Protocol 2: 3D Inflammatory Wound Healing Assay for Crohn's Fistula
- 3D Matrix Preparation: Mix rat tail Collagen I (3 mg/mL) with 10X PBS, 0.1M NaOH, and cell suspension to achieve final 2 mg/mL collagen with 500,000 CCD-18Co fibroblasts/mL. Plate 100 µL/well in a 96-well plate. Polymerize at 37°C for 1h.
- Epithelial Overlay & Wound: Seed 50,000 Caco-2 cells on top in complete medium. Culture for 72h to form a monolayer. Create a standardized linear "wound" using a 96-pin wounding tool.
- Inflammatory Conditioning & MSC Addition: Replace medium with low-serum (2% FBS) medium containing cytokine cocktail (TNF-α 10 ng/mL, IL-1β 5 ng/mL, IFN-γ 25 ng/mL). After 24h, add 25,000 MSCs (pre-stained with CellTracker dye) in suspension.
- Imaging & Analysis: Acquire images at the wound site at 0, 24, 48, and 72h using an inverted live-cell imager. Quantify wound area using image analysis software (e.g., ImageJ). Collect supernatant at 72h for PGE2 ELISA.
Diagrams
MSC Immunomodulation Pathway in GvHD
3D Co-culture Assay Workflow for Crohn's
Chondrogenic Potency Assay Decision Tree
The Scientist's Toolkit: Research Reagent Solutions
Table 2: Essential Reagents for Featured MSC Potency Assays
| Reagent / Material | Supplier Examples | Function in Assay | Critical Quality Attribute |
|---|---|---|---|
| GMP-grade Recombinant Human IFN-γ | PeproTech, R&D Systems | Primary stimulant for IDO1 upregulation in GvHD assays. | Specific activity (U/mg), endotoxin level (<0.1 EU/µg), certificate of analysis. |
| L-Kynurenine Standard | Sigma-Aldrich, Cayman Chemical | Reference standard for HPLC/MS quantification of IDO activity. | ≥98% purity (HPLC), suitable for preparing a traceable standard curve. |
| Collagen Type I, Rat Tail | Corning, Thermo Fisher | Extracellular matrix for 3D fibroblast embedding in fistula assays. | Consistent polymerization kinetics, low endotoxin, high concentration (≥3 mg/mL). |
| Prostaglandin E2 ELISA Kit | Cayman Chemical, Abcam | Quantifies PGE2, a key MSC-mediated immunomodulator in fistula healing. | Assay sensitivity (<10 pg/mL), specificity (no cross-reactivity with other prostaglandins). |
| Anti-Sox9 Antibody (Chondrogenic) | MilliporeSigma, Abcam | Primary antibody for staining early chondrogenic transcription factor in OA assays. | Validated for immunofluorescence in human MSCs, high specificity. |
| TGF-β3 & BMP-6 (Chondrogenic) | PeproTech, Cell Guidance Systems | Cytokine pair to drive robust chondrogenic differentiation in OA assays. | GMP-grade available, carrier protein-free for precise dosing. |
Navigating Challenges: Standardization, Variability, and GMP Fit-for-Purpose Optimization
FAQs & Troubleshooting Guides
Q1: Our MSC proliferation assay (e.g., CFU-F) shows high donor-to-donor variability, making it difficult to establish a consistent release specification. What are the key strategies to mitigate this?
A: Donor variability in proliferation is intrinsic. The strategy is not to eliminate it but to control and account for it through robust assay design and data normalization.
- Pre-Screening & Pooling: Pre-screen donor MSCs for baseline proliferation rates. For working cell banks, consider creating donor pools (e.g., 3-5 donors) to average out extreme variability.
- Reference Standard: Implement a well-characterized, stable Reference MSC Line (e.g., from a master donor) run in parallel on every assay plate. Express test sample results as a Relative Potency compared to the reference standard's dose-response curve.
- Normalization: Normalize proliferation data (e.g., cell count, metabolic activity) to a baseline measurement taken at the time of seeding (Day 0) to account for initial seeding variability.
Q2: How can we reduce passage-induced variability in differentiation potency assays (e.g., osteogenic or adipogenic differentiation)? Our late-passage cells consistently show reduced differentiation capacity.
A: Passage-induced senescence is a major contributor. Your assay system must define the Validated Passage Range.
- Critical Parameters to Monitor:
- Population Doublings (PDs): Track cumulative PDs instead of just passage number.
- Senescence Markers: Incorporate assays for β-galactosidase activity or p16/p21 expression to define a senescence threshold.
- Protocol Optimization: For late-passage cells within the validated range, you may need to optimize:
- Seeding Density: Increase cell density for differentiation assays to compensate for reduced responsiveness.
- Media Composition: Titrate and potentially increase concentration of key inducing factors (e.g., BMP-2 for osteogenesis).
Q3: Our immunomodulation assay (e.g., T-cell suppression assay) results are inconsistent between operators and batches. How can we improve robustness for a GMP-compliant system?
A: This complex, multi-cell system requires stringent control of all components.
- Key Variable Control:
- Responder Cells: Use cryopreserved, characterized PBMC or T-cell batches from a single donor for an entire assay validation study. Pre-test responder cell activity to a positive control (e.g., anti-CD3/CD28 beads).
- Effector-to-Target Ratio: Establish a fixed, optimal ratio (e.g., 1:10 MSC:PBMC) through a dose-response curve and do not deviate.
- Activation Stimulus: Use a standardized, titrated mitogen (e.g., PHA) or bead-based activator across all runs.
- Positive & Negative Controls: Include a validated, cryopreserved lot of Immunomodulatory Reference MSCs and a non-suppressive fibroblast cell line as controls in every run.
Experimental Protocols
Protocol 1: Establishing a Reference Standard for Proliferation Assays
- Select a Master Donor: Choose an MSC donor with median proliferation and differentiation characteristics.
- Banking: Create a large, cryopreserved Master Cell Bank (MCB) at an early passage (e.g., P2).
- Characterization: Fully characterize the MCB for identity (surface markers), viability, proliferation rate (PDT), tri-lineage differentiation potential, and immunomodulatory function.
- Working Ampoules: Create single-use ampoules from the MCB to serve as the Assay Reference Standard.
- Assay Calibration: In each potency assay run, include a dose-response of the thawed Reference Standard (e.g., 3-4 seeding densities). Generate a standard curve for the response (e.g., ATP content at Day 3). Express test sample potency relative to this curve.
Protocol 2: Validated Passage Range Determination Assay
- Cell Expansion: Expand MSCs from the MCB serially until senescence (growth arrest >1 week).
- Sampling: At each passage (e.g., P3, P5, P7, P9...), sample cells for:
- Growth Kinetics: Record PDs and calculate Population Doubling Time (PDT).
- Senescence: Perform β-galactosidase staining; calculate % positive cells.
- Function: Perform miniaturized potency assays (proliferation, differentiation).
- Data Analysis: Plot all parameters against cumulative PDs. Establish the upper PD limit where key potency metrics fall outside pre-defined specifications (e.g., >80% of maximum function).
Data Presentation
Table 1: Impact of Key Variables on MSC Potency Assays & Mitigation Strategies
| Variable | Affected Assay Type | Typical Impact | Primary Mitigation Strategy |
|---|---|---|---|
| Donor Source | All (Proliferation, Differentiation, Immunomodulation) | High variability in baseline potency | Use of pooled donors & reference-standard relative potency |
| Passage Number / PDs | Proliferation, Differentiation | Decreased potency, increased senescence | Define a validated passage/PD range; monitor senescence markers |
| Seeding Density | Differentiation, Immunomodulation | Altered differentiation efficiency, contact-dependent suppression | Rigorous pre-assay titration and fixed density |
| Serum/Lot | All (especially Proliferation) | Altered growth & differentiation kinetics | Use of defined, xeno-free media; lot qualification |
| Responder Cell Source | Immunomodulation | Highly variable activation kinetics | Use of characterized, cryopreserved PBMC/T-cell batches |
Table 2: Example Specification Setting for a Validated Passage Range
| Parameter | Acceptance Criterion (P3-P7 Example) | Test Method |
|---|---|---|
| Population Doubling Time (PDT) | ≤ 40 hours | Growth curve analysis |
| Senescence (β-galactosidase) | ≤ 20% positive cells | Histochemical stain |
| Osteogenic Potential | ≥ 2-fold increase in ALP activity vs. control | ALP enzymatic assay |
| Adipogenic Potential | ≥ 15% lipid-positive area (Oil Red O stain) | Image quantification |
| Immunomodulatory Activity | ≥ 50% suppression of T-cell proliferation | CFSE dilution assay |
Mandatory Visualizations
Title: Sources of Variability in MSC Potency Assays and Mitigation Pathways
Title: Workflow for Relative Potency Using a Reference Standard
The Scientist's Toolkit: Key Research Reagent Solutions
| Reagent / Material | Function in Taming Variability | Example / Note |
|---|---|---|
| Defined, Xeno-Free MSC Media | Eliminates lot-to-lot variability of serum; promotes consistent basal metabolism. | Commercial serum-free, platelet lysate-based, or fully defined formulations. |
| Pre-Qualified FBS / HS Lot | If serum is required, a single, large, pre-tested lot ensures consistency across years of development. | Lot must support growth and maintain potency functions. |
| Characterized Cryopreserved PBMCs | Provides a consistent source of responder cells for immunomodulation assays, reducing donor-driven noise. | From a single donor, large aliquot lot, pre-tested for responsiveness. |
| GMP-Grade Recombinant Inducers | High-purity, consistent-activity growth factors (FGF-2) and differentiation inducers (BMP-2, TGF-β1). | Essential for reproducible differentiation and maintaining undifferentiated state. |
| Viability Assay Kits (ATP-based) | Sensitive, quantitative readout for proliferation/cell health with low variability compared to manual counts. | Luminescence-based assays are preferred for robustness in GMP environments. |
| Senescence Detection Kits | Quantitative (fluorometric) measurement of β-galactosidase activity to objectively set passage limits. | More robust than histochemical stains for specification setting. |
| Flow Cytometry Validation Panels | Standardized antibody cocktails for identity (ISCT markers) and purity (contamination markers). | Pre-configured panels reduce staining variability and operator error. |
| Reference Standard MSC Line | The critical internal control for all potency assays, enabling relative reporting. | An internally developed, master-donor derived, extensively banked cell line. |
Troubleshooting Guides & FAQs
FAQ 1: Why is our potency assay showing high inter-assay variability despite using the same reference standard?
Answer: High variability often stems from improper handling or qualification of the reference standard. Ensure the reference standard is aliquoted upon first use to minimize freeze-thaw cycles, stored at the recommended temperature (typically ≤-65°C), and qualified for its intended use. For MSC potency assays, the reference standard must be fully characterized for identity, purity, viability, and specific biological activity (e.g., immunosuppression, differentiation potential). Implement a system suitability test using the reference standard in each assay run to monitor performance.
FAQ 2: How do we select a suitable positive control for an MSC immunomodulation assay?
Answer: The positive control must reliably demonstrate the expected assay response. For a T-cell proliferation inhibition assay, use a well-characterized MSC batch with known immunosuppressive activity as a run control. Alternatively, a pharmaceutical-grade immunosuppressant like Cyclosporin A can serve as a biochemical control. The control must be qualified to show it elicits a response within the assay's dynamic range. The table below summarizes control options:
Table: Control Options for MSC Immunomodulation Assays
| Control Type | Example Reagent | Qualification Requirement | Purpose |
|---|---|---|---|
| Assay Positive Control | Qualified MSC Reference Standard | Identity, viability, consistent inhibition >50% | Demonstrates assay capability to detect positive response |
| Inhibitor Control | Cyclosporin A (CsA) | Dose-response curve, known IC50 | Confirms T-cell responder cell functionality |
| Stimulation Control | Phytohemagglutinin (PHA) / CD3/CD28 beads | Dose-response for maximal proliferation | Validates responder cell health and assay setup |
FAQ 3: What are the key parameters for qualifying a critical reagent like a detection antibody for a cytokine ELISA in a potency assay?
Answer: Qualification establishes fitness for purpose. Key parameters include:
- Specificity: Verify no cross-reactivity with other analytes or media components.
- Sensitivity/LOD/LOQ: Determine if the antibody meets the required detection limits for the target cytokine.
- Precision: Assess inter- and intra-assay precision (CV% <20% is typically acceptable).
- Robustness: Test performance across acceptable variations in incubation time and temperature.
- Stability: Establish short-term (in-use) and long-term storage stability.
Protocol: Antibody Qualification for ELISA
- Coat ELISA plate with capture antibody overnight at 4°C.
- Block plate with suitable buffer (e.g., 1% BSA/PBS) for 1-2 hours.
- Generate a standard curve with recombinant cytokine and test samples in dilution series. Run in triplicate.
- Add detection antibody according to manufacturer's protocol.
- Add enzyme-conjugated secondary (if needed) and substrate. Read absorbance.
- Analysis: Calculate the coefficient of variation (CV) for replicates. Perform a linear regression on the standard curve to determine the Limit of Detection (LOD) and Lower Limit of Quantification (LOQ). Compare lot-to-lot parallelism.
FAQ 4: Our differentiation assay controls (osteogenic/adipogenic) are not consistently yielding expected results. What should we check?
Answer: Inconsistent differentiation often points to reagent stability or cell passage number issues.
- Verify Control Reagent Preparation: Differentiation inducers (e.g., dexamethasone, IBMX, indomethacin) are often labile. Prepare fresh aliquots from stable stocks and confirm storage conditions.
- Check MSC Passage Number: Use MSCs within a qualified passage range (e.g., P3-P8). Higher passages may lose differentiation potential.
- Include a Qualified Differentiation Control: Use a MSC batch with proven high differentiation efficiency in every run.
- Confirm Serum Lot Qualification: FBS lot can significantly impact differentiation. Use only qualified, differentiation-tested serum lots.
Table: Critical Reagents for MSC Trilineage Differentiation Assays
| Reagent | Function | Qualification Focus |
|---|---|---|
| Fetal Bovine Serum (FBS) | Provides growth factors & nutrients | Lot testing for growth support & differentiation efficiency; gamma-irradiated. |
| Mesenchymal Stem Cell Qualified FBS | Optimized for MSC growth | Certificate of Analysis for MSC growth and differentiation. |
| Osteogenic Inducers (Ascorbate, β-Glycerophosphate, Dexamethasone) | Induces osteoblast formation | Prepare fresh solutions; verify activity with control MSCs. |
| Adipogenic Inducers (IBMX, Dexamethasone, Indomethacin, Insulin) | Induces adipocyte formation | Verify stock concentration stability; test combination efficacy. |
| Chondrogenic Inducers (TGF-β3, BMP-6) | Induces chondrocyte formation in pellet culture | Confirm growth factor bioactivity via dose-response. |
The Scientist's Toolkit: Research Reagent Solutions
Table: Essential Materials for GMP-Compliant Critical Reagent Management
| Item | Function in Potency Assay Development |
|---|---|
| Cell-Based Reference Standard | Provides a benchmark for assay performance, calibration, and system suitability testing. Must be extensively characterized. |
| Recombinant Cytokine Standards | Used for generating standard curves in immunomodulation assays (e.g., IFN-γ, TNF-α ELISA). Traceable to international standards. |
| GMP-Grade Growth Media & Supplements | Ensures consistent MSC expansion without introducing variability from unqualified components. |
| Qualified FBS or Xeno-Free Media | Critical for cell growth and function. Requires strict lot-to-lot testing for MSC potency assays. |
| Validated PCR Primers/Probes | For qPCR-based potency markers (e.g., IDO1, TSG6). Must be tested for specificity, efficiency, and linear dynamic range. |
| Flow Cytometry Antibody Panels | For characterization and potency (e.g., immunophenotype, PD-L1 expression). Require titration, compensation, and specificity checks. |
| Functional Control Cells (e.g., Activated PBMCs) | Used as responder cells in immunomodulation assays. Require donor screening and functional qualification. |
Visualizations
Title: Critical Reagent Qualification Workflow for GMP
Title: IDO1-Mediated MSC Immunosuppression Pathway
Technical Support Center: Troubleshooting GMP-Compliant MSC Potency Assays
Frequently Asked Questions (FAQs)
Q1: After transfer, our QC lab reports high inter-operator variability in the trilineage differentiation assay (adirogenic, osteogenic, chondrogenic) used for MSC potency. The Oil Red O quantification data is inconsistent. What is the root cause and how do we fix it?
A1: High variability often stems from insufficiently defined acceptance criteria for differentiation induction and staining protocols. In R&D, researchers may use visual, qualitative assessment, but QC requires quantitative, validated endpoints.
Troubleshooting Guide:
- Issue: Inconsistent cell seeding density prior to induction.
- Solution: Implement a validated, automated cell counter with strict viability and density SOPs. Define a precise cell seeding number (e.g., 21,000 cells/cm² ± 5%) as a critical process parameter (CPP).
- Issue: Non-standardized staining, washing, and elution steps for Oil Red O.
- Solution: Replace subjective microscopic scoring with a validated dye elution and spectrophotometric quantification method. Use an internal control (e.g., a pre-qualified MSC batch with known differentiation capacity) on every plate.
- Issue: Uncontrolled differentiation media component preparation and storage.
- Solution: Source GMP-grade induction factors (e.g., dexamethasone, IBMX, indomethacin). Define their preparation logs, aliquot sizes, and expiration times post-reconstitution.
- Issue: Inconsistent cell seeding density prior to induction.
Detailed Protocol: Quantitative Oil Red O Assay for Adipogenic Potency
- Materials: MSC batch, GMP-grade adipogenic induction/media supplements, 12-well plates, 10% Neutral Buffered Formalin, 60% isopropanol, Oil Red O stock solution (0.5% in isopropanol), 100% isopropanol for elution, plate reader.
- Method:
- Seed MSCs at the validated density (e.g., 21,000 cells/cm²) in triplicate wells. Culture to confluence (Day 0).
- Initiate differentiation: Replace growth media with adipogenic induction media (containing insulin, dexamethasone, IBMX, indomethacin). Refresh media every 3-4 days.
- On Day 14, aspirate media. Wash wells with PBS and fix cells with 10% Formal in for 30 min at room temperature.
- Wash with dH₂O, then add 60% isopropanol for 5 min.
- Aspirate and add filtered Oil Red O working solution (3 parts stock:2 parts dH₂O) for 15 min.
- Wash extensively with dH₂O until water runs clear.
- For quantification: Add 100% isopropanol (1 mL/well) to elute the dye under gentle agitation for 10 min.
- Transfer 200 µL of eluate in duplicate to a 96-well plate. Measure absorbance at 510 nm.
- Acceptance Criterion: Test MSC batch must achieve ≥150% of the absorbance value of the predetermined reference standard (low-differentiating control) to pass potency.
Q2: Our immunosuppression potency assay (e.g., T-cell proliferation inhibition) shows loss of signal and poor precision in the QC environment. What are the critical control points?
A2: This functional assay is highly sensitive to donor variability of peripheral blood mononuclear cells (PBMCs) and assay conditions. R&D often uses research-grade, readily available PBMCs, while QC requires a controlled, qualified cell source.
- Troubleshooting Guide:
- Issue: Unqualified PBMC donor(s) leading to highly variable proliferative responses.
- Solution: Qualify and pool multiple cryopreserved PBMC donors from leukapheresis. Pre-test donor responsiveness to mitogens (e.g., PHA, anti-CD3/CD28 beads). Establish a qualified PBMC bank with a defined shelf-life and use a consistent donor pool for all QC testing.
- Issue: Inconsistent MSC to PBMC co-culture ratio and contact time.
- Solution: Validate and fix the effector:responder ratio (e.g., 1:10 MSC:PBMC) and the co-culture duration (e.g., 72 hours) as CPPs. Use irradiated or mitomycin-C treated MSCs to prevent overgrowth.
- Issue: Non-standardized T-cell activation and proliferation readout (e.g., CFSE dilution vs. thymidine incorporation).
- Solution: Transition to a robust, GMP-compliant readout. [3H]-thymidine incorporation, while sensitive, has regulatory and waste burdens. Consider switching to a non-radioactive, flow cytometry-based method (e.g., CFSE dilution with counting beads for absolute cell number) validated for precision and accuracy.
- Issue: Unqualified PBMC donor(s) leading to highly variable proliferative responses.
Q3: During analytical method transfer, our qPCR-based potency assay (for specific mRNA markers) fails system suitability due to changing amplification efficiency and high Ct values.
A3: This indicates variability in RNA quality, cDNA synthesis efficiency, or reagent performance. R&D protocols often lack robustness for routine testing.
- Troubleshooting Guide:
- Issue: Manual RNA isolation introduces variability in purity and yield.
- Solution: Implement a validated, automated magnetic bead-based nucleic acid extraction system. Define critical input cell numbers and elution volumes.
- Issue: Use of non-GMP reverse transcription (RT) and qPCR master mixes with lot-to-lot variability.
- Solution: Source qualified, GMP-manufactured RT and qPCR kits with documented performance criteria. Perform lot-to-lot qualification before use in QC.
- Issue: Inadequate definition of assay controls.
- Solution: Include a full suite of controls: no-template control (NTC), positive control (synthetic RNA template), endogenous housekeeping control (e.g., GAPDH, 18S rRNA), and a reference MSC sample. Set acceptance criteria for control Ct values and amplification curves.
- Issue: Manual RNA isolation introduces variability in purity and yield.
Table 1: Common Pitfalls and Mitigation Strategies in MSC Potency Assay Transfer
| Assay Type | Common R&D Practice | QC/QA Requirement | Key Mitigation Strategy | Target Acceptance Criterion |
|---|---|---|---|---|
| Trilineage Differentiation | Qualitative, visual scoring; research-grade inducers. | Quantitative, spectrophotometric readout; GMP-grade reagents. | Validate dye elution protocol; use qualified reference standard. | OD510 ≥150% of low-control reference. |
| Immunomodulation (T-cell) | Ad-hoc PBMC donors; variable readouts. | Qualified PBMC donor pool; standardized, validated readout (e.g., flow cytometry). | Establish & characterize a cryopreserved PBMC bank; validate CFSE/bead assay. | % Inhibition of proliferation = 50% ± 15% (at specified MSC:PBMC ratio). |
| qPCR Marker Analysis | Manual RNA isolation; research-grade kits. | Automated extraction; qualified GMP-grade kits; full control panel. | Implement automated extraction system; perform kit lot qualification. | Amplification efficiency = 90-110%; R² > 0.98; Control Ct within ±1 cycle of mean. |
| Viability / Cell Count | Manual hemocytometer; variable trypan blue exclusion. | Automated cell counter with viability stain; SOP for sampling. | Validate counter against manual method for precision; define sampling plan. | Viability > 95% pre-cryopreservation; count accuracy ±5% of expected. |
The Scientist's Toolkit: Research Reagent Solutions
Table 2: Essential Materials for GMP-Compliant MSC Potency Assay Development
| Item | Function | GMP-Compliant Sourcing Consideration |
|---|---|---|
| GMP-Grade FBS/Xeno-Free Media | Provides consistent, defined growth factors for MSC expansion without introducing animal-source variability. | Must have full traceability, Certificate of Analysis (CoA), and be from an approved supplier. |
| Qualified PBMC Donor Pool | Provides a consistent, responsive immune cell source for immunomodulation potency assays. | Sourced from accredited blood banks under IRB; characterized for proliferation capacity; cryopreserved in master banks. |
| GMP-Grade Differentiation Inducers (e.g., Dexamethasone, TGF-β3) | Induces reproducible lineage-specific differentiation for potency assessment. | Must have Drug Master File (DMF) or equivalent regulatory support; defined stability profiles. |
| Validated qPCR Assay Kits (RT & Amplification) | Ensures sensitive, specific, and reproducible quantification of potency markers (e.g., IDO1, PTGS2). | Kits should be manufactured under ISO 13485 or equivalent; require lot-to-lot qualification data. |
| Automated Cell Counter & Viability Analyzer | Provides objective, precise, and accurate cell count and viability data, a critical quality attribute (CQA). | Instrument must be qualified (IQ/OQ/PQ) and software must be compliant with 21 CFR Part 11 if used for GMP release. |
| Reference Standard MSC Batch | Serves as a system suitability control for all potency assays, bridging R&D and QC data. | A well-characterized, cryopreserved bank of MSCs with defined low, medium, and high potency profiles. |
Visualizations
Diagram 1: MSC Potency Assay Tech Transfer Workflow
Diagram 2: Key Signaling Pathways in MSC Immunomodulation Potency Assay
Addressing Matrix Interference in Complex Culture Media or Formulation Buffers
Troubleshooting Guides & FAQs
Q1: Why does my cell-based potency assay (e.g., immunomodulation) show high background or variable signal when testing MSC-conditioned media directly? A: Complex media (e.g., DMEM/F12 with FBS or HPL) and formulation buffers (e.g., cryopreservation buffers with DMSO) contain high concentrations of proteins, lipids, salts, and metabolites. These can interfere with assay readouts by: 1) Non-specifically activating or inhibiting reporter cells, 2) Quenching luminescence or fluorescence signals, 3) Binding to critical assay reagents (e.g., antibodies, cytokines).
Recommended Protocol: Sample Pre-treatment for Signal-to-Noise Improvement
- Sample: Collect MSC-conditioned media or a sample spiked with your analyte of interest (e.g., IDO activity product, kynurenine).
- Dilution Series: Perform a 1:2 serial dilution of the sample in plain assay buffer and in fresh, unconcentrated base media.
- Assay: Run your detection assay (e.g., colorimetric kynurenine assay) on both dilution sets.
- Analysis: Plot signal vs. dilution. A non-parallel curve in the media-diluted set indicates matrix interference. The point where dilution in assay buffer yields a linear, proportional response is the optimal Minimum Required Dilution (MRD).
Q2: How do I determine the Minimum Required Dilution (MRD) for my sample matrix in a GMP potency assay? A: The MRD is the dilution at which matrix interference is eliminated but the analyte signal remains reliably above the quantitation limit. It must be experimentally determined and validated.
Recommended Protocol: MRD Determination via Spike/Recovery
- Prepare Samples: Aliquot your blank matrix (e.g., final formulation buffer).
- Spike: Add a known concentration of your purified analyte standard (e.g., recombinant VEGF, PGE2) at a level relevant to your MSC product's potency (e.g., Low, Mid, High range of your standard curve).
- Dilute: Prepare a series of dilutions (e.g., 1:2, 1:4, 1:8, 1:16) for each spiked sample in your assay buffer.
- Analyze: Run the diluted samples in your potency assay. Calculate % Recovery at each dilution:
(Measured Concentration / Expected Concentration) * 100. - Establish MRD: The MRD is the lowest dilution factor where recovery for all spike levels falls within 70-130% (or your validated acceptance criteria).
Table 1: Example MRD Spike/Recovery Data for an MSC Angiogenic Potency Assay (VEGF ELISA)
| Matrix | Spike Level (pg/mL) | Dilution (Factor) | Measured Conc. (pg/mL) | % Recovery | Acceptable? |
|---|---|---|---|---|---|
| Cryo-Buffer | 250 (Mid) | 1:2 | 180 | 72% | Yes |
| Cryo-Buffer | 250 (Mid) | 1:4 | 235 | 94% | Yes |
| Cryo-Buffer | 250 (Mid) | 1:8 | 245 | 98% | Yes |
| HPL Media | 100 (Low) | 1:2 | 55 | 55% | No |
| HPL Media | 100 (Low) | 1:4 | 82 | 82% | Yes |
| HPL Media | 100 (Low) | 1:8 | 95 | 95% | Yes |
Conclusion: MRD for Cryo-Buffer = 1:2; MRD for HPL Media = 1:4.
Q3: What physical sample preparation techniques can reduce interference from proteins and lipids before analysis? A: For assays like LC-MS or HPLC, or to clean samples for plate-based assays, specific purification steps are essential.
Recommended Protocol: Solid-Phase Extraction (SPE) for Lipid/Protein Removal
- Condition SPE Cartridge: Pass 1 mL of methanol through a reverse-phase C18 cartridge, followed by 1 mL of water or dilute acid/base (pH-matched to sample).
- Load Sample: Apply your acidified or prepared sample (e.g., for PGE2 analysis) slowly to the cartridge. Discard flow-through.
- Wash: Pass 1-2 mL of a water/organic solvent mix (e.g., 10% methanol in water) to remove salts and polar interferents. Discard.
- Elute Analyte: Pass 0.5-1 mL of a strong organic solvent (e.g., acetonitrile or methanol) to elute your target analyte. Collect this fraction.
- Dry & Reconstitute: Evaporate the eluent under nitrogen or vacuum. Reconstitute the dry residue in your assay buffer at the desired MRD for analysis.
Table 2: Comparison of Matrix Interference Mitigation Strategies
| Strategy | Principle | Best For | Key Limitation |
|---|---|---|---|
| Simple Dilution (MRD) | Reduces interferent concentration below effect threshold. | High-abundance analytes; quick screening. | May dilute analyte below LLOQ. |
| Solid-Phase Extraction (SPE) | Selective binding & washing of analyte/interferents. | Small molecules (e.g., metabolites, PGE2). | Method development intensive; analyte loss risk. |
| Protein Precipitation | Adding organic solvent (ACN, MeOH) to precipitate proteins. | Removing proteins for downstream analysis. | Incomplete for lipids/salts; dilutes sample. |
| Affinity Capture | Use of specific antibodies/beads to isolate analyte. | Proteins (e.g., cytokines) from complex soup. | High cost; may not remove all interferent classes. |
| Dialysis/Ultrafiltration | Size-exclusion separation through a membrane. | Exchanging buffer; removing small molecules from proteins. | Time-consuming; adsorption to membrane. |
The Scientist's Toolkit: Key Research Reagent Solutions
| Item | Function & Relevance to Potency Assays |
|---|---|
| Defined, Xeno-Free Basal Media | Serves as a low-interference base for preparing standards and diluting samples. Critical for assay robustness. |
| Analyte-Free Matrix Blanks | Identical to test matrix but without the MSC product (e.g., spent media from unseeded wells). Essential for background subtraction and specificity controls. |
| Stable Isotope-Labeled Internal Standards (SIL-IS) | For LC-MS assays. Added to all samples prior to processing to correct for analyte loss during preparation and ionization suppression. |
| Magnetic Bead-based Cytokine Kits | Often provide buffers optimized for reducing matrix effects in serum/plasma, adaptable for MSC media. |
| Low-Protein Binding Plates/Tubes | Minimizes nonspecific adsorption of your analyte (especially proteins at low concentration) during dilution and assay steps. |
| GMP-Grade Reference Standard | Fully characterized analyte (e.g., recombinant human protein) for spiking recovery experiments and standard curve generation. |
Visualizations
Diagram 1: Strategy Selection for Matrix Interference
Diagram 2: Experimental Workflow for MRD Determination
Optimizing for Throughput, Cost, and Timelines Without Sacrificing Quality
Establishing a robust, GMP-compliant potency assay for Mesenchymal Stromal Cells (MSCs) is a critical and challenging step in drug development. This technical support center provides targeted troubleshooting and FAQs to address common issues encountered during assay development and validation, ensuring that optimization efforts for speed and cost do not compromise the quality and regulatory standing of your final product.
Troubleshooting Guides & FAQs
Q1: Our cell-based potency assay (e.g., immunomodulation assay) shows unacceptably high inter-assay variability, jeopardizing reproducibility. What are the key factors to investigate?
A: High variability often stems from inconsistencies in critical starting materials or environmental conditions.
- Primary Culprit: MSC Donor/Source and Passage Number. Assay sensitivity can shift dramatically between donors and at higher passages. Solution: Implement strict cell banking strategies. Use a characterized Master Cell Bank (MCB) as the source for all assay development and qualify a narrow, low passage window (e.g., P3-P5) for the assay effector cells.
- Reagent Variability: Fetal Bovine Serum (FBS) or other media components vary by lot. Solution: Perform extensive lot-testing and qualification of all key reagents before use in assay development. Consider moving towards xeno-free, chemically defined media.
- Target Cell Instability: The responsiveness of the target cells (e.g., peripheral blood mononuclear cells - PBMCs) in co-culture assays can vary. Solution: Use a cryopreserved, qualified batch of PBMCs from a single donor for development to minimize this variable.
Q2: During the development of a quantitative potency assay (like an ELISA for secreted factor IDO1), we are struggling with poor assay sensitivity and a narrow dynamic range.
A: This typically relates to reagent optimization and detection system limitations.
- Antibody Pair & Standard: Ensure the antibody pair (capture/detection) is specifically validated for the analyte in your MSC supernatant matrix. The reference standard must be highly pure and identical to the native analyte. Solution: Perform a checkerboard titration for all antibodies and sample dilutions to find the optimal concentration. Spike-and-recovery experiments in complete MSC-conditioned media are mandatory to assess matrix interference.
- Signal Detection: Consider switching to a more sensitive detection method, such as electrochemiluminescence (ECL), if colorimetric ELISA limits are reached. Ensure the microplate reader is calibrated and using the correct wavelength/filters.
Q3: How can we justify moving from a multi-parametric, complex functional assay to a simpler, surrogate molecular assay (like qPCR for a key gene) for routine GMP release without compromising quality?
A: This requires robust scientific justification through a correlation study, as per ICH Q6B and USP <1033>.
- Correlation Analysis: You must demonstrate a direct, statistically significant correlation between the results of the complex "gold standard" bioassay and the proposed surrogate assay across multiple MSC batches, including those with intentionally modified potency (e.g., by heat inactivation, passage-induced senescence).
- Defining Acceptance Criteria: Establish a validated correlation model (e.g., linear regression) with defined acceptance criteria (e.g., R² > 0.90). The surrogate assay must be able to discriminate between potent and sub-potent batches as effectively as the primary bioassay.
Q4: We need to increase assay throughput for lot-release but are concerned about automation introducing errors. What are the critical validation steps for automating a manual potency assay?
A: A rigorous comparability study is essential.
- Parallel Testing: Run a statistically significant number of samples (e.g., n≥20 from different batches) using both the manual and automated methods.
- Statistical Analysis: Perform equivalence testing (e.g., using a t-test or Bland-Altman analysis) to prove no significant difference between the methods. Key parameters to compare are precision (inter-assay %CV), accuracy, and the reported potency value.
- Process Qualification: Validate the automated system's liquid handling accuracy and precision independently before the assay comparability study.
Experimental Protocols
Protocol 1: MSC Immunomodulation Potency Assay (PBMC Proliferation Inhibition)
Objective: To quantify the ability of MSCs to suppress activated T-cell proliferation as a measure of immunomodulatory potency.
Methodology:
- Effector Cell Prep: Harvest qualified MSCs (from MCB, P4-P5), seed in a 96-well plate at 3-5 densities (e.g., 1x10³ to 2.5x10⁴ cells/well) in triplicate. Allow to adhere overnight.
- Target Cell Prep: Thaw qualified, cryopreserved PBMCs. Label with a cell proliferation dye (e.g., CFSE).
- Stimulation & Co-culture: Activate CFSE-labeled PBMCs with CD3/CD28 activation beads. Add activated PBMCs to the MSC-seeded wells at a fixed ratio (e.g., 1:10 MSC:PBMC). Include controls (PBMCs alone with/without activation).
- Incubation: Culture for 5-6 days.
- Flow Cytometry Analysis: Harvest co-culture, stain for CD3+ T-cells, and analyze CFSE dilution by flow cytometry to determine percentage proliferation inhibition.
- Dose-Response & IC50: Plot % inhibition vs. MSC log(density). Calculate the MSC density required for 50% inhibition (IC50) using a 4-parameter logistic (4PL) curve fit. The IC50 serves as the primary potency metric.
Protocol 2: Surrogate Molecular Potency Assay Correlation Study
Objective: To validate a qPCR assay for IDO1 expression as a surrogate for the functional immunomodulation assay.
Methodology:
- Sample Generation: Generate a panel of 15-20 MSC batches with expected potency variation. Include production batches, R&D batches, and "stress-changed" batches (e.g., high passage, cytokine-primed).
- Parallel Testing: For each batch:
- Perform the full Protocol 1 to obtain the functional IC50 value.
- In parallel, plate MSCs from the same vial, stimulate with IFN-γ for 24h, then lyse for RNA extraction.
- Perform reverse transcription and quantitative PCR (qPCR) for IDO1 and a stable reference gene (e.g., GAPDH). Calculate relative IDO1 expression (2^-ΔΔCt).
- Correlation Analysis: Plot functional IC50 (Y-axis) vs. relative IDO1 expression (X-axis). Perform linear regression analysis. Establish the correlation coefficient (R²) and the 95% confidence interval of the regression line.
Data Presentation
Table 1: Comparative Analysis of Potency Assay Platforms
| Assay Platform | Typical Duration | Approx. Cost per Sample (Reagents) | Key Source of Variability | Best Suited For |
|---|---|---|---|---|
| Cell-Based Bioassay (e.g., PBMC inhibition) | 5-7 days | $150 - $300 | Donor cells, serum lot, passage number | Definitive potency, mechanism-reflective. |
| Surrogate Molecular Assay (e.g., qPCR/ELISA) | 1-2 days | $50 - $100 | RNA integrity, primer specificity, standard curve | High-throughput release after correlation. |
| Flow Cytometry (Surface Marker) | 1 day | $75 - $150 | Antibody lot, gating strategy | Identity/purity; can be potency-correlated. |
Table 2: Correlation Study Results Example (Hypothetical Data)
| MSC Batch Type | Functional Assay IC50 (MSC cells/well) | Surrogate qPCR (Relative IDO1 Expression) | Within Spec? (Y/N) |
|---|---|---|---|
| Production Batch A | 5200 | 1.05 | Y |
| Production Batch B | 5800 | 0.98 | Y |
| High-Passage Batch | 12500 | 0.41 | N |
| IFN-γ Primed Batch | 2200 | 2.35 | Y |
| Correlation Metrics | Value | Acceptance Criteria | Result |
| Linear Regression R² | 0.94 | R² > 0.90 | Pass |
| Slope 95% CI | 0.85 - 0.99 | Excludes 0 | Pass |
Diagrams
GMP Potency Assay Development Workflow
IDO1 Signaling in MSC Immunomodulation
The Scientist's Toolkit: Research Reagent Solutions
| Item | Function in MSC Potency Assay Development |
|---|---|
| Characterized MSC Master Cell Bank (MCB) | Provides a consistent, qualified source of cells with defined potency, reducing donor-related variability. Essential for GMP. |
| Xeno-Free, Chemically Defined MSC Media | Eliminates variability from serum lots, improves assay consistency, and is preferred for regulatory filings. |
| Cryopreserved, Qualified PBMC Donor Batch | Standardized target cells for immunomodulation assays, minimizing variability in T-cell responsiveness. |
| Graded IFN-γ (Reference Standard) | Critical for inducing IDO1 in MSC potency assays. Must be a qualified reagent with known activity. |
| Validated Antibody Pair (IDO1 ELISA) | For quantifying IDO1 protein secretion. Specificity and lot-to-lot consistency are paramount. |
| TaqMan qPCR Assay for IDO1 | A pre-validated, gene-specific probe assay ensures specific and reproducible quantification of IDO1 mRNA. |
| Cell Proliferation Dye (e.g., CFSE) | Allows precise measurement of T-cell proliferation inhibition in co-culture assays via flow cytometry. |
| 4-Parameter Logistic (4PL) Curve Software | Essential for calculating accurate IC50/EC50 values from dose-response data in potency assays. |
Proving Assay Performance: A Step-by-Step Guide to GMP Validation and Comparative Analysis
Technical Support Center: Troubleshooting Potency Assay Validation for MSC Therapies
Frequently Asked Questions (FAQs)
Q1: During specificity testing for our MSC immunomodulation assay, we observe high background signal in the control (non-MSC) wells. What could be the cause and how can we resolve it? A: High background often indicates non-specific binding of detection antibodies or cytokine carryover. Troubleshooting steps include: 1) Increase the number of wash steps after sample incubation, 2) Optimize antibody dilution to find the optimal signal-to-noise ratio, 3) Include a blocking step with 5% BSA or serum from the host species of the detection antibody, and 4) Ensure all reagents are at room temperature before use to prevent condensation.
Q2: Our accuracy (recovery) experiments for a cytokine ELISA quantitation are consistently low (~70%). What are the most common sources of this error? A: Low recovery in MSC potency assays typically stems from matrix interference or analyte instability. First, ensure your standard is prepared in the same matrix as your test samples (e.g., spent media with matching serum concentration). Second, check the stability of the analyte during sample processing; use protease inhibitors if necessary. Third, verify the calibration standard is certified and within its validity period.
Q3: Intermediate Precision (Ruggedness) shows high %RSD between analysts in our cell-based viability assay. How can we improve consistency? A: High inter-analyst variability commonly arises from subtle differences in cell handling. Implement these protocols: 1) Create a detailed, step-by-step SOP with visual aids for cell seeding and feeding. 2) Pre-aliquot all critical reagents to minimize pipetting variability. 3) Mandate joint training sessions until results converge. 4) Consider using an automated cell counter and dispenser to standardize cell number at assay initiation.
Q4: When establishing linearity for a qPCR-based potency marker, the curve fails at high concentrations. What should we check? A: Failure at high concentrations typically indicates PCR inhibition or detector saturation. Dilute your samples to ensure they fall within the dynamic range of the assay. Also, check the integrity of your cDNA; degradation can cause non-linear response. Run a standard curve with each plate and ensure the amplification efficiency is between 90-110%.
Q5: How do we justify the "Range" for a multi-cytokine secretion potency assay when MSCs from different donors show variable secretion levels? A: The validated range must encompass the expected variability from your manufacturing process. Compile historical data from at least 10 different MSC donor lots. The lower limit of the range should be set at or below the lowest observed potency value, and the upper limit at or above the highest. Include a safety margin of 20%.
Q6: During robustness testing, altering the incubation time by 10% causes a significant shift in result. Does this invalidate the method? A: Not necessarily, but it defines a critical parameter. Your SOP must fix this parameter with a tight tolerance. Document this finding and specify the exact incubation time (e.g., 120 ± 5 minutes) in the final method. Robustness testing is designed to identify such critical parameters so they can be controlled during routine use.
Table 1: Typical Acceptance Criteria for MSC Potency Assay Validation (ICH Q2(R2) Based)
| Validation Parameter | Recommended Experiment | Typical Acceptance Criteria for MSC Assays | Common Issues |
|---|---|---|---|
| Specificity | Compare analyte response in presence/absence of matrix components (e.g., other cell types). | No significant interference (<20% signal change). Signal in blank ≤ LOD. | Matrix effects, cross-reactivity. |
| Accuracy (Recovery) | Spiking known amounts of reference standard into sample matrix at 3 levels (low, mid, high). | Mean recovery 80-120%. RSD < 10%. | Improper matrix matching, analyte degradation. |
| Precision - Repeatability | Analyze 6 replicates of a homogeneous MSC sample at 100% potency. | %RSD ≤ 15% for cell-based assays. | Cell seeding inconsistency, reagent variability. |
| Precision - Intermediate Precision | Perform repeatability experiment on different days, with different analysts, equipment. | Overall %RSD ≤ 20-25%. No statistically significant difference between runs (p>0.05). | Lack of SOP rigor, environmental fluctuations. |
| Linearity | Analyze at least 5 concentrations of analyte from 50-150% of target range. | Correlation coefficient (r) ≥ 0.990. Residuals randomly distributed. | Incorrect standard preparation, assay range exceeded. |
| Range | Confirm that accuracy, precision, and linearity are acceptable across the specified interval. | Meets all criteria across the claimed range (e.g., 70-130% of nominal potency). | Range set too narrowly based on limited donor data. |
| Robustness | Deliberately vary key parameters (pH, temp, time) in a pre-planned experimental design (e.g., Plackett-Burman). | Method performs acceptably under all minor variations. Identifies critical parameters. | Uncontrolled critical parameters leading to assay failure. |
Detailed Experimental Protocols
Protocol 1: Specificity Testing for an MSC-Mediated T-Cell Proliferation Assay Objective: To demonstrate the measured inhibition of T-cell proliferation is specific to MSC function and not caused by non-specific matrix effects.
- Prepare Components: Isolate PBMCs (responder cells), irradiate stimulator cells. Prepare test MSCs and a non-functional control (e.g., heat-inactivated MSCs).
- Co-culture Setup: Set up triplicate wells in a 96-well plate: a) T-cells + stimulators (Max Proliferation Control), b) T-cells + stimulators + Test MSCs, c) T-cells + stimulators + Inactivated MSCs, d) Culture medium only (Background).
- Incubation: Incubate for 5 days at 37°C, 5% CO2.
- Proliferation Measurement: Add a calibrated dose of BrdU or AlamarBlue for the final 4-8 hours. Measure fluorescence/absorbance.
- Calculation & Acceptance: Specificity is confirmed if the signal from the Inactivated MSC control is not statistically different from the Max Proliferation Control, while Test MSCs show significant inhibition.
Protocol 2: Accuracy (Recovery) for ELISA-Based Cytokine Quantification Objective: To determine the closeness of agreement between the measured value and the true value of an analyte spiked into the sample matrix.
- Prepare Matrix: Use conditioned medium from a null cell line or a pool of MSC media without the target cytokine.
- Spike Solutions: Prepare a reference standard stock solution of known, high concentration. Spike the matrix to create three concentrations (Low: near QL, Medium: 100% target, High: near top of range). Prepare unspiked matrix as control.
- Sample Analysis: Analyze each spiked level (n=3) and the unspiked matrix using the validated ELISA protocol.
- Calculation: %Recovery = [(Measured Concentration - Endogenous Concentration) / Spiked Concentration] x 100.
- Acceptance: Mean recovery for each level should be within 80-120%, with RSD < 10%.
Visualizations
Workflow for MSC Potency Assay Validation
MSC Immunomodulation Potency Pathway
The Scientist's Toolkit: Key Research Reagent Solutions
Table 2: Essential Materials for MSC Potency Assay Development & Validation
| Item | Function & Role in Validation | Example/Consideration for MSCs |
|---|---|---|
| Reference Standard | Serves as the primary benchmark for accuracy, linearity, and range. Must be well-characterized and stable. | Internationally recognized MSC line (e.g., hTERT-MSC) or an in-house primary MSC master cell bank. |
| Qualified Donor PBMCs | Critical for immunomodulation assays (e.g., T-cell proliferation). Provides the responsive biological system. | Must be from multiple donors, pre-qualified for response, and cryopreserved in large, identical aliquots. |
| Validated Detection Kits | For quantifying potency markers (ELISA, Luminex, qPCR kits). Their performance directly impacts specificity and precision. | Select kits with certificates of analysis, validated for use in complex matrices like cell culture supernatant. |
| Cell Culture Media | The matrix for the assay. Consistency is vital for robustness. | Use a single, large lot of serum/xeno-free media for the entire validation study to minimize variability. |
| Calibrated Equipment | Pipettes, plate readers, incubators, flow cytometers. Precision relies on their performance. | Regular calibration records are mandatory. Use the same equipment set for a validation parameter where possible. |
| Statistical Software | For calculating means, RSD, linear regression, ANOVA for intermediate precision. | Use validated or qualified software (e.g., JMP, SoftMax Pro, PLA) suitable for GMP data analysis. |
Technical Support Center: Troubleshooting Guides & FAQs
This support center addresses common challenges in linking in vitro potency assay results to in vivo clinical outcomes for Mesenchymal Stromal Cell (MSC) therapies under GMP development.
FAQ 1: Why does my potency assay (e.g., IDO activity) show high variability, making it difficult to set a release specification? Answer: High inter-assay variability often stems from inconsistent cell handling or reagent instability, decoupling the assay readout from the true biological potency. To mitigate:
- Standardize Passage & Seeding: Use cells within a strict, validated passage range (e.g., P4-P6) and ensure consistent seeding density using an automated cell counter.
- Implement a Reference Standard: Use a well-characterized, cryopreserved MSC batch as an internal control in every assay run to normalize results and track assay performance over time.
- Control Critical Reagents: Qualify and use single lots of key cytokines (e.g., IFN-γ) for an entire study. Perform a stability study for prepared assay media.
Experimental Protocol: IDO Potency Assay for Immunomodulatory MSCs
- Principle: Measure kynurenine production as a surrogate for indoleamine 2,3-dioxygenase (IDO) activity, induced by IFN-γ stimulation.
- Materials: MSC test article, qualified IFN-γ stock, tryptophan-supplemented medium, trichloroacetic acid, Ehrlich’s reagent, spectrophotometer/plate reader.
- Method:
- Seed MSCs in a 96-well plate at a validated density (e.g., 10,000 cells/well) in triplicate.
- After 24h, stimulate test wells with a titrated dose of IFN-γ (e.g., 10-100 ng/mL). Include unstimulated control wells.
- Incubate for 48-72h at 37°C, 5% CO₂.
- Transfer supernatant to a new plate. Add trichloroacetic acid (final concentration 4%), mix, and incubate at 50°C for 30 min to hydrolyze N-formylkynurenine to kynurenine.
- Centrifuge at 2500 rpm for 10 min.
- Transfer supernatant to a fresh plate, add an equal volume of Ehrlich’s reagent, and incubate at room temperature for 10-15 min.
- Measure absorbance at 490 nm.
- Calculate kynurenine concentration using a standard curve. Report as µM kynurenine produced per 10⁴ cells over time.
FAQ 2: How do I correlate an in vitro angiogenesis (tube formation) assay score with in vivo efficacy for a pro-angiogenic MSC therapy? Answer: Direct quantitative correlation is challenging. The in vitro assay is a relative potency measure. Follow this workflow:
- Establish a Predicted Potency Range: Using multiple MSC donor lines and production lots, generate a histogram of tube formation scores (e.g., total tube length) against a reference standard.
- Conjugate with In Vivo Data: In a preclinical model (e.g., murine hindlimb ischemia), dose with MSCs from the high, mid, and low ranges of your in vitro potency scale.
- Define a Minimum Effective Potency: Identify the lowest in vitro assay value that still produces a statistically significant therapeutic effect in vivo (e.g., increased perfusion). This becomes a critical release limit.
Experimental Protocol: In Vitro Tube Formation Assay
- Principle: Assess the pro-angiogenic potential of MSC secretome by quantifying human umbilical vein endothelial cell (HUVEC) network formation on Matrigel.
- Materials: Growth Factor Reduced Matrigel, HUVECs, MSC-conditioned medium (MSC-CM), endothelial basal medium (EBM-2), 96-well plate, imager, analysis software (e.g., ImageJ Angiogenesis Analyzer).
- Method:
- Thaw Matrigel on ice overnight. Coat each well of a pre-chilled 96-well plate with 50 µL Matrigel. Incubate at 37°C for 30-60 min to polymerize.
- Harvest HUVECs and resuspend in a 1:1 mix of EBM-2 and test MSC-CM (centrifuged and filtered).
- Seed 15,000-20,000 HUVECs per well on the polymerized Matrigel.
- Incubate at 37°C, 5% CO₂ for 4-18 hours.
- Capture images (4x or 10x magnification) from multiple, non-overlapping fields per well.
- Analyze images for parameters: Total Tube Length, Number of Junctions, and Number of Meshes.
Data Presentation: Key Quantitative Correlations
Table 1: Linking In Vitro Potency to Preclinical In Vivo Efficacy
| MSC Product Lot | In Vitro IDO Activity (µM Kynurenine) | In Vivo Mouse GvHD Model: Median Survival (Days) | Clinical Dose Equivalent (Cells/kg) |
|---|---|---|---|
| Reference Std | 12.5 ± 1.2 | 45 | 2 x 10⁶ |
| GMP Batch A | 14.1 ± 0.8 | 48 | 2 x 10⁶ |
| GMP Batch B | 8.9 ± 1.5* | 32* | (Fails Release) |
| GMP Batch C | 11.0 ± 0.9 | 41 | 2.2 x 10⁶ |
| Acceptance Criterion | ≥ 10.0 | ≥ 38 | Derived from Correlation |
Indicates a batch failing the proposed potency specification, correlating with significantly reduced *in vivo efficacy.*
Table 2: Example Acceptance Criteria for a Pro-Angiogenic MSC Potency Assay
| Analytical Parameter | Target Value | Release Specification | Justification |
|---|---|---|---|
| Total Tube Length | ≥ 12000 pixels/field | ≥ 9000 pixels/field | 75% of target; ensures minimum angiogenic potential. |
| Inter-assay CV | < 15% | < 20% | GMP requirement for assay robustness. |
| Reference Standard Relative Potency | 100% | 70-130% | Ensures consistent assay performance over time. |
Visualizations
Title: Linking Potency Assays to Clinical Outcomes
Title: IDO Potency Assay Signaling Pathway
The Scientist's Toolkit: Key Research Reagent Solutions
| Item | Function in Potency Assay Development | Critical Consideration for GMP |
|---|---|---|
| Qualified IFN-γ | Primary stimulant for immunomodulatory assays (IDO, PGE2). | Use a single, qualified GMP or RUO lot for entire program. Document source and Certificate of Analysis. |
| Growth Factor Reduced Matrigel | Substrate for in vitro tube formation assays. | Batch variability is high. Qualify each new lot against the previous one using a reference MSC standard. |
| Defined Fetal Bovine Serum (FBS) or Xeno-free Media | Cell culture expansion and assay medium. | For GMP, aim for xeno-free, fully defined formulations to reduce variability and regulatory risk. |
| Cell Viability/Proliferation Kits (e.g., MTT, ATP) | Normalize potency readouts to viable cell number. | Validate the kit for linearity with your MSC type. Ensure reagents are stable and compatible. |
| Cytokine ELISA/Kits (e.g., PGE2, VEGF) | Quantify secreted mediators as potency markers. | Establish assay range, precision, and accuracy. Optimize sample collection (use inhibitors if needed). |
| Cryopreserved MSC Reference Standard | Internal control for inter-assay normalization and trending. | Fully characterize (potency, identity, sterility). Create a large master bank to last the product lifecycle. |
| GMP-Grade qPCR Reagents | For identity (STR) and potency-relevant gene expression assays. | Validate primers, probes, and conditions. Include no-template and genomic DNA controls. |
Technical Support Center
Frequently Asked Questions & Troubleshooting Guides
FAQ 1: What defines a "stability-indicating" potency assay for MSCs in a GMP context? A stability-indicating assay (SIA) is a validated method that accurately and reliably measures the active pharmaceutical ingredient (API) or, for cell therapies, the biological activity (potency), in the presence of degradation products, excipients, and other matrix components. For MSC therapies under GMP, it must demonstrate specificity to changes in the critical quality attribute (CQA) of potency upon stress conditions (e.g., temperature, shear, time). The assay result should correlate directly with the product's biological function and decrease predictably as the product degrades.
FAQ 2: Why is my potency assay not showing a trend during forced degradation studies?
- Root Cause: The assay may not be measuring a CQA linked to the mechanism of action (MoA). It could be insensitive to the specific degradation pathways of your MSC product.
- Troubleshooting Steps:
- Re-evaluate MoA: Confirm the primary therapeutic function (e.g., immunomodulation via IDO activity, angiogenesis via VEGF secretion).
- Design Stress Tests: Apply relevant stresses (e.g., heat shock, freeze-thaw, prolonged culture) and assess a broader panel of potency markers.
- Use Orthogonal Assays: Implement a multi-parametric potency panel. If one assay is unresponsive, another may be stability-indicating.
- Protocol: Forced Degradation Study for MSC Potency Assay Qualification
- Objective: To challenge the MSC product and determine if the potency assay detects loss of activity.
- Materials: Vials of final drug product (DP).
- Procedure:
- Heat Stress: Incubate DP vials at 40°C for 2, 4, and 8 hours. Include controls at 2-8°C.
- Freeze-Thaw Stress: Subject DP to 1, 2, and 3 cycles of freezing (-80°C) and thawing (37°C).
- Extended Holding: Hold DP at the recommended storage temperature (e.g., 2-8°C or -150°C) for 1.5x and 2x the proposed shelf-life.
- Assay: At each time point, perform the candidate potency assay (e.g., co-culture suppression assay, quantitative cytokine ELISA) alongside viability and identity assays.
- Acceptance: A significant (p<0.05), dose-dependent decrease in potency with increasing stress indicates a stability-indicating property.
FAQ 3: How do I establish a potency-based shelf-life specification for my MSC product?
- Issue: Determining the acceptance criterion for potency at expiry.
- Solution: This is derived from stability study data and clinical relevance.
- Conduct real-time and accelerated stability studies on GMP-produced batches.
- Plot potency (e.g., % suppression, ng of factor secreted) against time.
- Using statistical analysis (e.g., 95% confidence limit), determine the time point at which the lower confidence interval intersects the proposed lower specification limit.
- The lower specification limit should be justified by linking clinical efficacy data (Phase I/II) to a minimum required biological activity level. If no clinical data exists, use data from non-clinical in vivo models.
FAQ 4: My potency assay has high variability (>20% CV), making shelf-life trends unreliable. How can I improve precision?
- Potential Causes & Fixes:
- Cell-Based Readout Variability: Switch to a more controlled reporter assay or implement a standardized, qualified responder cell bank.
- Reagent Inconsistency: Use GMP-grade, qualified reagents with certificates of analysis. See "Scientist's Toolkit" below.
- Protocol Ambiguity: Fully parameterize the method (exact cell seeding density, medium volume, incubation time).
- Data Analysis: Employ robust curve-fitting models (4PL) and ensure the assay is run in the linear dynamic range.
Data Presentation: Stability Study Results
Table 1: Example Real-Time Stability Data for an MSC Product Potency (IDO Activity Assay)
| Time Point (Months at -150°C) | Potency (pmol Kynurenine/10^6 cells/hr) | Viability (% Live Cells) | Purity (% CD105+/CD90+) |
|---|---|---|---|
| 0 (Release) | 450 ± 35 | 95% ± 2% | 98% ± 1% |
| 3 | 445 ± 40 | 94% ± 3% | 98% ± 2% |
| 6 | 430 ± 38 | 93% ± 4% | 97% ± 2% |
| 9 | 410 ± 42 | 90% ± 5% | 96% ± 3% |
| 12 | 395 ± 45 | 88% ± 5% | 95% ± 3% |
Table 2: Forced Degradation Results Linking Potency to Product Degradation
| Stress Condition | Viability Change | Potency Change | Specific Activity (Potency/Viability) | Stability-Indicating? |
|---|---|---|---|---|
| Control (2-8°C, 24h) | None | None | Unchanged | N/A |
| Heat Stress (40°C, 8h) | -15% | -60% | -53% | Yes |
| Freeze-Thaw (3 cycles) | -25% | -70% | -60% | Yes |
| Mechanical Shear (Perfusion) | -5% | -40% | -37% | Yes |
Experimental Protocols
Protocol: Multi-Parametric Potency Assay for Immunomodulatory MSCs
- Objective: Quantify the stability-indicating potency of MSCs via key functional markers.
- Method 1: IDO Enzymatic Activity (HPLC)
- Stimulate 2x10^5 MSCs with 100 ng/mL IFN-γ for 48 hours.
- Wash cells and incubate in 1 mL of 2 mM L-tryptophan in PBS for 4 hours.
- Collect supernatant, deproteinize, and analyze kynurenine by HPLC (UV detection at 360 nm).
- Calculate enzymatic activity as pmol kynurenine produced per hour per 10^6 cells.
- Method 2: T-cell Suppression Co-culture
- Activate PBMCs (Responder) with CD3/CD28 beads.
- Co-culture activated PBMCs with irradiated MSCs (Effector) at ratios (e.g., 10:1, 5:1, 1:1) for 72 hours.
- Pulse with ³H-thymidine for final 18 hours.
- Measure incorporation. Calculate % suppression:
[1 - (cpm co-culture / cpm PBMC alone)] * 100.
Mandatory Visualization
Diagram 1: MSC Potency Assay Development & Qualification Workflow
Diagram 2: Key Signaling Pathways in MSC Immunomodulation Potency
The Scientist's Toolkit
Table 3: Key Research Reagent Solutions for GMP-Compliant Potency Assays
| Reagent / Material | Function in Potency Assay | Critical GMP Consideration |
|---|---|---|
| Qualified Fetal Bovine Serum (FBS) or Xeno-Free Medium | Provides essential growth factors and nutrients for MSC maintenance during assay. | Must be from an approved vendor with full traceability, TSE/BSE statement, and rigorous testing for adventitious agents. |
| GMP-Grade Cytokines (e.g., IFN-γ, TNF-α) | Used to stimulate MSCs to elicit their potency-related response (e.g., IDO activation). | Requires certificate of analysis (CoA) detailing purity, potency, endotoxin levels, and absence of host cell DNA/protein. |
| Standardized Responder Cell Bank (e.g., PBMCs, T-cells) | Provides a consistent biological sensor for functional assays (e.g., suppression). | Must be banked under controlled conditions, characterized for identity and function, and tested for mycoplasma and pathogens. |
| Reference Standard Cell Bank | A well-characterized MSC bank used as a positive control to monitor assay performance over time. | Essential for assay qualification/validation. Must be from a master/working cell bank system with defined passage and potency. |
| End-Point Detection Kits (e.g., ELISA, Luminescence) | Quantifies analytes (VEGF, PGE2, IDO activity) or cellular responses (ATP, proliferation). | Use validated, GMP-ready kits. Verify kit performance (range, accuracy) with your sample matrix during assay development. |
Troubleshooting Guides and FAQs
FAQ: General Platform Issues
Q1: Our ELISA results show high background signal, making low-concentration cytokine detection unreliable. What are the primary causes and solutions? A: High background in ELISA is often due to non-specific binding or incomplete washing. Ensure proper blocking (use 5% BSA or suitable protein blocker for 1-2 hours at RT) and optimize wash buffer stringency (consider adding 0.05% Tween-20). Check antibody cross-reactivity and titrate all reagents. For GMP-compliant MSC potency assays, this is critical for validating the assay's lower limit of quantitation (LLOQ).
Q2: When transitioning a qPCR-based trilineage differentiation assay from research to GLP/GMP, what are the key validation parameters to address? A: Key parameters include: Specificity: Demonstrate primer specificity via melt curve analysis and gel electrophoresis. Accuracy/Precision: Perform spike-recovery and repeatability studies (≤25% CV). Linearity/Range: 5-log dynamic range with R² >0.98. Robustness: Test impact of minor changes in RNA input, enzyme lot, and thermal cycler. Document all reagents with Certificates of Analysis (CoA).
Q3: Our flow cytometry-based immunophenotyping results for MSCs show lot-to-lot variability in marker expression percentages. How can we stabilize the assay? A: Implement a daily calibration protocol using standardized fluorescent beads. Establish a robust staining SOP: fix cells within 2 hours of harvest, use titrated antibody cocktails, and include isotype and fluorescence-minus-one (FMO) controls. For GMP, qualify the flow cytometer with performance qualification (PQ) tests and use identical reagent lots for a given product lot release.
Q4: In a cell-based angiogenesis assay (e.g., endothelial tube formation), what controls are mandatory for a potency assay submitted to regulators? A: Mandatory controls include: 1) A reference MSC batch with known potency, 2) A positive control (e.g., VEGF at 50 ng/mL), 3) A negative control (cell-free matrix), and 4) An inhibition control (e.g., anti-VEGF antibody). Assay acceptance criteria must be pre-defined (e.g., tube length > X pixels for positive control).
Q5: We observe inconsistent results in a luminescence-based ATP assay for cell viability. What are the troubleshooting steps? A: Inconsistency often stems from cell lysis timing or temperature sensitivity. Follow this protocol: equilibrate assay buffer to room temperature, add equal volume of lysis reagent directly to culture medium, mix on orbital shaker for 5 minutes, then read luminescence immediately. Validate with a standard curve of known ATP concentrations for each run.
Table 1: Quantitative Comparison of Key Assay Platform Performance Characteristics
| Platform | Typical CV (%) | Approx. Cost per Sample (USD) | Time to Result | Throughput (Samples/Day) | Key Regulatory Guideline |
|---|---|---|---|---|---|
| ELISA | 10-15% | $25 - $100 | 4 - 8 hours | 40 - 100 | ICH Q2(R1), USP <1032> |
| Flow Cytometry | 5-12% | $50 - $200 | 2 - 6 hours | 20 - 80 | FDA Guidance on Bioanalytical Methods, ISO 20391 |
| qPCR/dPCR | 5-10% | $15 - $80 | 2 - 4 hours | 50 - 200 | MIQE Guidelines, ICH Q2(R1) |
| Cell-Based Bioassay | 15-25% | $100 - $500 | 1 - 14 days | 10 - 50 | USP <1033>, <1034>; ICH Q6B |
| Luminescence/Viability | 8-20% | $5 - $30 | 0.5 - 2 hours | 100 - 500 | USP <1032>, ATP Standard Curves Required |
Table 2: Pros and Cons for GMP Potency Assay Development
| Platform | Pros | Cons | Regulatory Acceptance Level |
|---|---|---|---|
| ELISA | High specificity, quantitative, scalable, well-understood. | Measures quantity, not biological activity; antibody-dependent. | High. Standard for product release if correlated to potency. |
| Flow Cytometry | Multiplexing, single-cell resolution, phenotypic and functional readouts. | Complex data analysis, instrument sensitivity, requires live cells. | Medium-High. Accepted for identity/purity; potency requires robust validation. |
| qPCR/dPCR | Extremely sensitive, precise, high throughput, measures gene expression. | Indirect measure of protein/function, requires RNA/DNA isolation. | Medium. Excellent as a complementary assay; may not stand alone for potency. |
| Cell-Based Bioassay | Measures functional biological activity, clinically relevant. | Highly variable, long duration, low throughput, complex standardization. | High (when validated). Often considered the "gold standard" for potency. |
| Luminescence (e.g., ATP) | Rapid, sensitive, homogeneous, high throughput. | Can be non-specific, measures a surrogate (e.g., metabolism). | Medium. Often used for viability; for potency, requires strong correlation to function. |
Experimental Protocols
Protocol 1: GMP-Compliant ELISA for Anti-inflammatory Cytokine (IDO) Potency Assay Principle: Quantify Indoleamine 2,3-dioxygenase (IDO) activity in MSC supernatant via kynurenine production, a key anti-inflammatory mechanism. Method:
- Cell Stimulation: Plate MSCs at 5,000 cells/cm². At 80% confluence, stimulate with IFN-γ (100 IU/mL) for 48 hours.
- Sample Prep: Collect supernatant, centrifuge at 500xg for 10 min to remove debris. Store at -80°C if not used immediately.
- Kynurenine Assay: Mix 50µL supernatant with 50µL of 30% trichloroacetic acid, vortex, centrifuge at 10,000xg for 5 min.
- Detection: Transfer 75µL of supernatant to a flat-bottom 96-well plate, add 75µL of Ehrlich's reagent (2% p-dimethylaminobenzaldehyde in glacial acetic acid).
- Reading: Incubate at RT for 10 min, read absorbance at 492 nm. Calculate concentration against a L-kynurenine standard curve (0-200 µM).
- Validation: Include unstimulated MSC control, IFN-γ-only control, and a reference MSC batch. Calculate specific activity (µM kynurenine/µg protein/time).
Protocol 2: Flow Cytometry for MSC Immunopotency (PD-L1 Expression) Principle: Measure programmed death-ligand 1 (PD-L1) surface expression as a potency marker for MSCs' immunomodulatory capacity post-IFN-γ licensing. Method:
- Cell Licensing: Stimulate MSCs with 50 ng/mL IFN-γ for 24 hours. Include unstimulated control.
- Harvest & Wash: Detach with trypsin/EDTA, neutralize, wash twice in cold PBS + 2% FBS (FACS buffer).
- Staining: Aliquot 1x10^5 cells per tube. Stain with anti-human CD274 (PD-L1) APC antibody (titrated volume) or isotype control in 100µL FACS buffer for 30 min at 4°C in the dark.
- Wash & Fix: Wash cells twice, resuspend in 200µL of 1% paraformaldehyde.
- Acquisition: Acquire on a calibrated flow cytometer within 24 hours. Collect ≥10,000 events per sample.
- Analysis: Gate on live cell population (FSC/SSC). Report % PD-L1 positive cells and Median Fluorescence Intensity (MFI) ratio vs. isotype. Document all instrument performance qualification (PQ) data.
Diagrams
Diagram Title: PD-L1 Upregulation Pathway in MSCs for Immunopotency
Diagram Title: IDO Activity ELISA Workflow for MSC Potency
The Scientist's Toolkit: Research Reagent Solutions
Table 3: Essential Reagents for MSC Potency Assay Development
| Item | Function | Example/Note for GMP Compliance |
|---|---|---|
| Recombinant Human IFN-γ | Key cytokine to "license" or activate MSC immunomodulatory functions. | Use GMP-grade, sourced with full traceability and CoA for release assays. |
| Fluorochrome-conjugated Anti-human Antibodies (CD274/PD-L1, CD73, CD90, CD105) | Phenotypic characterization and potency marker detection via flow cytometry. | Select clones validated for flow, supply with regulatory support file (RSF). |
| L-Kynurenine Standard | Reference standard for quantitative IDO activity ELISA calibration. | Source from certified supplier (e.g., USP reference standard if available). |
| ATP Standard Solution | Calibrator for luminescence-based viability/potency assays. | Prepare fresh daily from certified stock; document stability. |
| qPCR Master Mix with ROX | Enzymatic mix for quantitative gene expression analysis of differentiation markers (e.g., RUNX2, PPARγ). | Use a mix validated for low CV; ensure consistent enzyme lot for a product program. |
| Endothelial Cell Tube Formation Assay Kit (GFR Basement Membrane Matrix) | Matrix for functional angiogenesis bioassay to measure MSC secretory potency. | Qualify each lot for consistent polymerization and growth factor background. |
| Cell Viability Stain (e.g., Propidium Iodide/7-AAD) | Distinguish live/dead cells in flow cytometry or imaging assays. | Validate staining concentration and incubation time for specific MSC type. |
| Reference MSC Line | Well-characterized cells serving as positive control and assay calibrator. | Critical for GMP. Bank under cGMP conditions, establish acceptance ranges for potency. |
Technical Support Center: Troubleshooting Potency Assay Development for MSCs
FAQ: Documentation & Strategy Justification
Q1: How much historical assay development data must we include in our submission to justify the final qualified/validated method?
- A: Regulatory agencies expect a science-based, risk-driven rationale. You must document the critical quality attributes (CQAs) your assay measures, the selection process for the assay format (e.g., why an ELISA over a flow cytometry-based method), and key development data. This includes initial feasibility, optimization experiments (e.g., matrix interference, cell seeding density titration), and a summary of rejected approaches with justification. Present this concisely with a focus on data that informed the final protocol.
Q2: Our MSC potency assay (e.g., an IDO activity assay) shows high inter-assay variability during pre-qualification. What are the first parameters to investigate?
- A: High variability often stems from biological or reagent inconsistencies. Follow this troubleshooting guide:
- Cell Source: Ensure consistent MSC passage number, viability (>90%), and confluency at harvest.
- Reagent Qualification: Use qualified, same-lot reagents. Pre-qualify new lots of critical components like cytokines (e.g., IFN-γ) and enzyme substrates.
- Assay Controls: Implement a robust system of positive controls (e.g., a reference MSC batch with known potency) and negative controls (e.g., IDO-inhibited cells).
- Data Normalization: Explore normalization to cell number (e.g., via DNA content) if seeding density is variable.
- A: High variability often stems from biological or reagent inconsistencies. Follow this troubleshooting guide:
Q3: What is the minimum sample size (n) for establishing assay precision (repeatability and intermediate precision) during qualification?
- A: Current guidelines (e.g., ICH Q2(R2)) do not prescribe a fixed 'n' but emphasize a statistically sound approach. A common and defensible practice is:
- Repeatability: 6 replicates across 3 independent runs (total n=18).
- Intermediate Precision: 2 analysts, 2 days, using different critical reagent lots, with 3 replicates per condition.
- Present precision data as %CV with confidence intervals.
- A: Current guidelines (e.g., ICH Q2(R2)) do not prescribe a fixed 'n' but emphasize a statistically sound approach. A common and defensible practice is:
Experimental Protocol: Qualification of an IDO Enzymatic Activity Potency Assay
1. Title: Qualification of Indoleamine 2,3-Dioxygenase (IDO) Activity in MSCs via Kynurenine Detection by HPLC.
2. Scope: To establish accuracy, precision, linearity, and range of the IDO activity assay for GMP-compliant MSC potency assessment.
3. Materials & Reagents:
- Test Articles: Three distinct batches of cryopreserved MSCs.
- Stimulation Medium: Serum-free basal medium supplemented with 100 ng/mL IFN-γ.
- Control Medium: Basal medium without IFN-γ.
- Inhibitor Control: Medium with 500 μM 1-Methyl-DL-tryptophan (1-MT).
- L-Tryptophan Solution: 500 μM in PBS.
- Deproteinization Solution: 30% (w/v) Trichloroacetic acid.
- Ehrlich’s Reagent: 100 mg p-Dimethylaminobenzaldehyde in 5 mL glacial acetic acid.
- HPLC System with UV detector.
4. Procedure:
- Cell Preparation: Thaw MSCs and plate at 10,000 cells/well in a 96-well plate. Incubate for 24 hours.
- Stimulation: Replace medium with (a) Stimulation Medium, (b) Control Medium, (c) Stimulation Medium + 1-MT. Incubate for 48 hours.
- Reaction Initiation: Add L-Tryptophan solution to a final concentration of 50 μM. Incubate for 4 hours.
- Sample Collection: Collect supernatant. Add an equal volume of trichloroacetic acid, vortex, and centrifuge at 15,000xg for 10 min.
- Derivatization & Detection: Mix clarified supernatant with Ehrlich’s reagent (1:1 v/v). Incubate for 30 min at room temperature, protected from light.
- HPLC Analysis: Inject 50 μL onto a C18 column. Detect kynurenine at 360 nm. Use a purified kynurenine standard curve (0.5 - 100 μM) for quantification.
- Data Analysis: Calculate IDO activity as pmol kynurenine produced per hour per 10^6 cells. Subtract values from inhibitor control wells.
5. Acceptance Criteria: The method must demonstrate:
- Linearity: R² > 0.99 for the standard curve.
- Accuracy: Spiked recovery of kynurenine in cell supernatant between 80-120%.
- Precision: Repeatability CV < 15%, Intermediate Precision CV < 20%.
Data Presentation Table: Example Qualification Results for IDO Activity Assay
| Qualification Parameter | Result | Acceptance Criteria | Status |
|---|---|---|---|
| Linearity (Standard Curve) | R² = 0.998 | R² > 0.99 | Pass |
| Range | 1.0 - 80.0 μM Kynurenine | Covers expected sample range | Pass |
| Accuracy (% Recovery) | 95% (n=9) | 80-120% | Pass |
| Repeatability (%CV) | 8.2% (n=18) | ≤ 15% | Pass |
| Intermediate Precision (%CV) | 16.5% (n=36) | ≤ 20% | Pass |
| Specificity | No interference from cell matrix | Complete resolution of peak | Pass |
The Scientist's Toolkit: Key Reagent Solutions for MSC Potency Assays
| Reagent / Material | Function in Potency Assay | Critical Quality Attribute |
|---|---|---|
| Recombinant Human IFN-γ | Primary cytokine to stimulate immunomodulatory functions (IDO, PGE2) in MSCs. | Biological activity (IU/μg), endotoxin level (<0.1 EU/μg). |
| Characterized FBS / Xeno-Free Media | Provides consistent growth factors and nutrients for cell health during assay. | Lot-to-lot consistency, growth promotion testing, absence of specific contaminants. |
| Viability Stain (e.g., Propidium Iodide) | Distinguishes live from dead cells in flow cytometry-based co-culture assays. | Fluorescence specificity, stability. |
| Kynurenine / PGE2 ELISA Kit | Quantifies soluble mediators of MSC potency. | Assay range, sensitivity, specificity, cross-reactivity profile. |
| Flow Cytometry Antibody Panel | Detects surface markers (e.g., PD-L1, HLA-DR) upregulated upon MSC stimulation. | Fluorochrome brightness, specificity, validated titration. |
| Reference Standard MSC Batch | Serves as a system suitability control across all potency assay runs. | Fully characterized, stable upon cryopreservation, stored in aliquots. |
Diagrams
Title: MSC Potency Assay Development Workflow
Title: Key IDO Potency Pathway in MSCs
Conclusion
Developing a GMP-compliant potency assay is not a final checkpoint but a fundamental, iterative component of MSC therapeutic development. Success requires early integration of a 'potency-by-design' philosophy, selection of a methodologically sound and MoA-relevant assay panel, meticulous optimization to control variability, and rigorous validation against regulatory standards. As the field evolves, future directions will likely see increased adoption of standardized reference materials, multi-omics correlative models, and real-time, non-destructive potency monitoring technologies. By mastering this roadmap, developers can robustly demonstrate that their MSC product is not just alive, but predictably potent—turning a regulatory requirement into a strategic asset for clinical translation and patient benefit.